Fig. 4
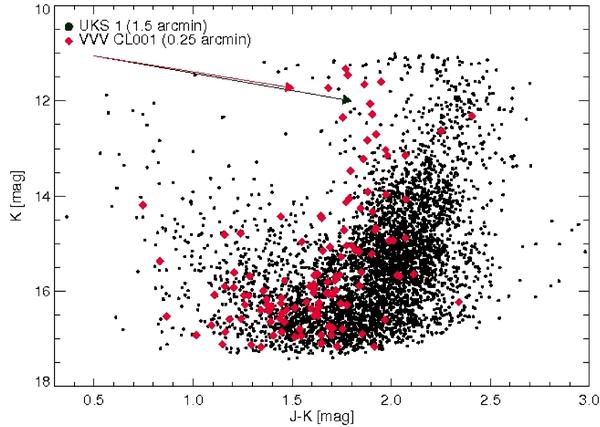
CMD of VVV CL001 (diamonds) compared with UKS 1 (dots). The horizontal-branch red clump of UKS 1 is seen at KS = 15.3, J − KS = 2.0. This diagram shows that the RGB of VVV CL001 is slightly bluer than that of UKS 1, from which one can conclude that VVV CL001 is less reddened or more metal-poor than UKS 1, and that the RGB of UKS 1 is much more populated, indicative of the low mass of VVV CL001. The legend gives the radius of the selected cluster region, whereas the arrows indicate the reddening derived for UKS 1.
Current usage metrics show cumulative count of Article Views (full-text article views including HTML views, PDF and ePub downloads, according to the available data) and Abstracts Views on Vision4Press platform.
Data correspond to usage on the plateform after 2015. The current usage metrics is available 48-96 hours after online publication and is updated daily on week days.
Initial download of the metrics may take a while.