Fig. 2
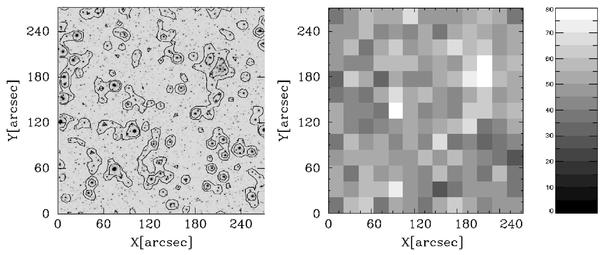
J-band image of the VVV CL001 region (left) and density of all objects. The contours in the left panel refer to the intensity level of the image. In contrast, to derive the significance of the overdensity (right) only detections with a Dophot classification parameter 1 or 7 (Schechter et al. 1993) were selected. The sources were binned into 60 × 60 pixel bins (20 by 20 arcsec). We note that even with PSF photometry we are unable to resolve the inner region of VVV CL001 (or UKS 1), which certainly affects the numerical results of our analysis (density, significance of the detected over-density). Both plots show the same 272 by 272 arcsec section of the J-band image.
Current usage metrics show cumulative count of Article Views (full-text article views including HTML views, PDF and ePub downloads, according to the available data) and Abstracts Views on Vision4Press platform.
Data correspond to usage on the plateform after 2015. The current usage metrics is available 48-96 hours after online publication and is updated daily on week days.
Initial download of the metrics may take a while.