Fig.A.1
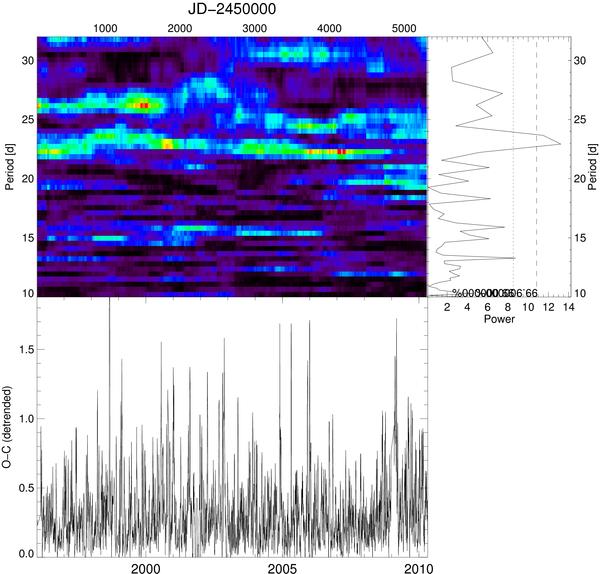
Dynamical power density spectrum (PDS) of the complete RXTE/ASM smoothed daily light curve (with negative flux values and the large burst of January 2009 removed). For the method to generate such a PDS see Wilms et al. (2001). Here we used an individual data set length of 2000d, a step size of 10d, calculating the power for 50 trial periods in the search range for the orbital period between 10d and 32d. A broad peak of enhanced power is found between 22d and 25d.
Current usage metrics show cumulative count of Article Views (full-text article views including HTML views, PDF and ePub downloads, according to the available data) and Abstracts Views on Vision4Press platform.
Data correspond to usage on the plateform after 2015. The current usage metrics is available 48-96 hours after online publication and is updated daily on week days.
Initial download of the metrics may take a while.