Free Access
Fig.1
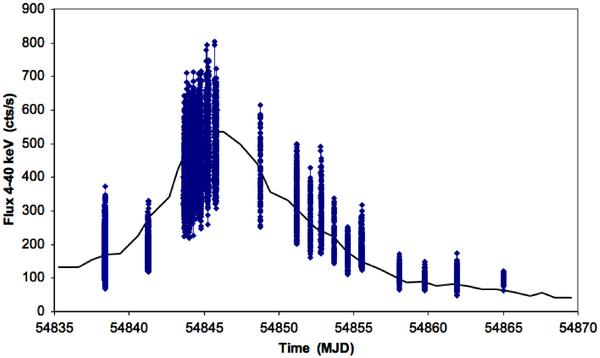
The light curve of the outburst of 1A 1118-616 as observed by RXTE/PCA (4–40keV) in January 2009. The time resolution is 16s. The continuous curve is the daily light curve as seen by RXTE/ASM (scaled to the PCA count rate and smoothed by taking the running mean of five consecutive days).
Current usage metrics show cumulative count of Article Views (full-text article views including HTML views, PDF and ePub downloads, according to the available data) and Abstracts Views on Vision4Press platform.
Data correspond to usage on the plateform after 2015. The current usage metrics is available 48-96 hours after online publication and is updated daily on week days.
Initial download of the metrics may take a while.