Free Access
Fig.2
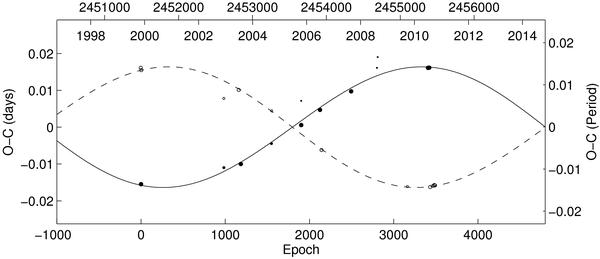
O − C diagram of V490 Cyg. The lines represent the fit according to the apsidal motion hypothesis (see text and Table 2), the solid line stands for the primary, while the dashed line stands for the secondary minima, dots stand for the primary and open circles for the secondary minima.
Current usage metrics show cumulative count of Article Views (full-text article views including HTML views, PDF and ePub downloads, according to the available data) and Abstracts Views on Vision4Press platform.
Data correspond to usage on the plateform after 2015. The current usage metrics is available 48-96 hours after online publication and is updated daily on week days.
Initial download of the metrics may take a while.