Free Access
Fig. C.2
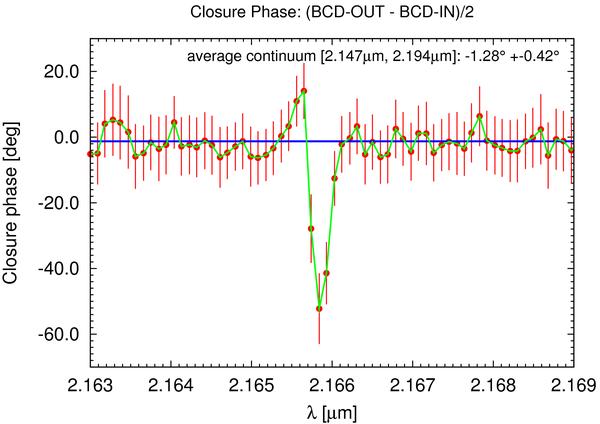
BCD-calibrated closure phase signal obtained by subtracting the calibrated closure phases obtained from the BCD IN and BCD OUT data. The blue line is the fit of a constant to the continuum (2.147–2.194 μm) closure phase outside the Brγ line.
Current usage metrics show cumulative count of Article Views (full-text article views including HTML views, PDF and ePub downloads, according to the available data) and Abstracts Views on Vision4Press platform.
Data correspond to usage on the plateform after 2015. The current usage metrics is available 48-96 hours after online publication and is updated daily on week days.
Initial download of the metrics may take a while.