Fig. 3
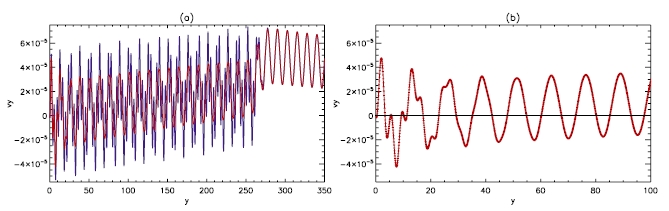
a) Longitudinal perturbations vy for η = 0.01, β = 0.1 plasma comparing η = 0.01, ν = 0 (blue) and ν = 0.01, η = 0 (red). Note only 0 ≤ y ≤ 350 is shown and that the agreement after y ≈ 280 is excellent (the two curves lie on each other). b) Blow-up of vy over region 0 ≤ y ≤ 100 for ν = 0.01, η = 0 plasma only, where crosses indicate grid point resolution. Black line indicates vy = 0. In both subfigures, t = 1000τA.
Current usage metrics show cumulative count of Article Views (full-text article views including HTML views, PDF and ePub downloads, according to the available data) and Abstracts Views on Vision4Press platform.
Data correspond to usage on the plateform after 2015. The current usage metrics is available 48-96 hours after online publication and is updated daily on week days.
Initial download of the metrics may take a while.