Fig. 2
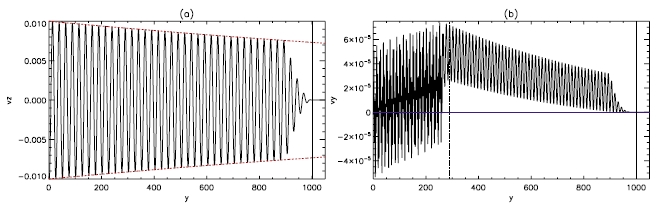
a) Transverse perturbations vz for η = 0.01, β = 0.1 plasma (ν = 0), where dashed lines represent the envelope vz = ± Aexp(kIy). b) Longitudinal perturbations vy for same plasma, where dashed line represents y = cst and blue horizontal line denotes vy = 0. In both subfigures, t = 1000τA and dotted line represents y = vAt.
Current usage metrics show cumulative count of Article Views (full-text article views including HTML views, PDF and ePub downloads, according to the available data) and Abstracts Views on Vision4Press platform.
Data correspond to usage on the plateform after 2015. The current usage metrics is available 48-96 hours after online publication and is updated daily on week days.
Initial download of the metrics may take a while.