Fig. 16
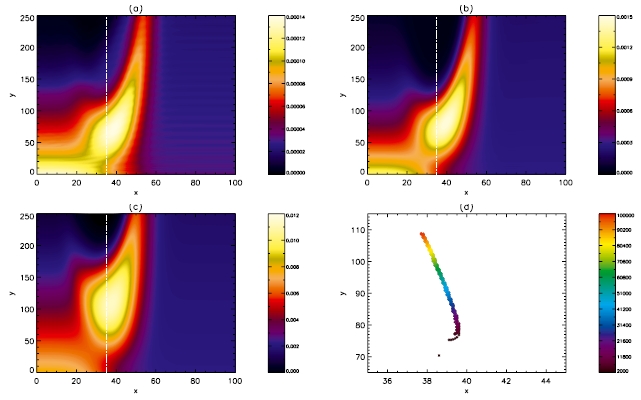
Contour of T − T0 at a) t = 1000τA, b) t = 10 000τA and c) t = 100 000τA. Dashed white line denotes x = 35. d) Plots (diamonds) the location of the maximum of T − T0 over 2000τA ≤ t ≤ 100 000τA. Also plotted (single star) is the location at t = 1000τA. In subfigures a) − c), each colour bar represents magnitude, whereas in (d) the corresponding colour bar donotes time.
Current usage metrics show cumulative count of Article Views (full-text article views including HTML views, PDF and ePub downloads, according to the available data) and Abstracts Views on Vision4Press platform.
Data correspond to usage on the plateform after 2015. The current usage metrics is available 48-96 hours after online publication and is updated daily on week days.
Initial download of the metrics may take a while.