Fig. 3
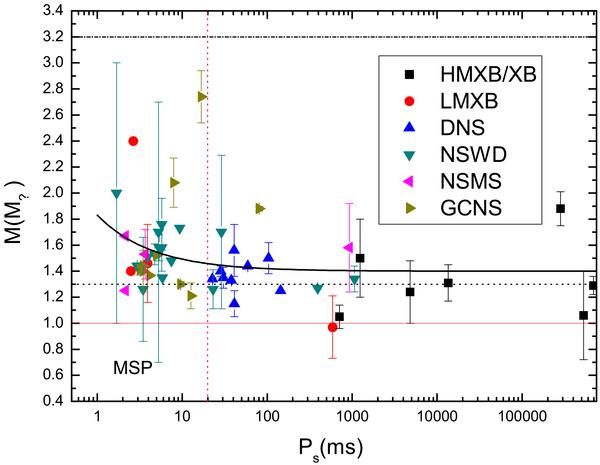
Diagram of mass versus spin period for 39 NSs. The horizontal line
M = 1 M⊙
(3.2 M⊙) stands for the measured minimum mass
(theoretical maximum mass, see Rhoades & Ruffini 1974). The vertical line at 20 ms separates the samples into two
groups, MSP (<20 ms) and less recycled NS (>20 ms). It is found
that the mass averages of two groups are, respectively,
1.57 ± 0.35 M⊙ and
1.37 ± 0.23 M⊙. The solid curve stands for the
relation between accretion mass and spin period of recycled pulsar as described in
Eqs. (1) and (2),  (M⊙).
(M⊙).
Current usage metrics show cumulative count of Article Views (full-text article views including HTML views, PDF and ePub downloads, according to the available data) and Abstracts Views on Vision4Press platform.
Data correspond to usage on the plateform after 2015. The current usage metrics is available 48-96 hours after online publication and is updated daily on week days.
Initial download of the metrics may take a while.