Fig. 3
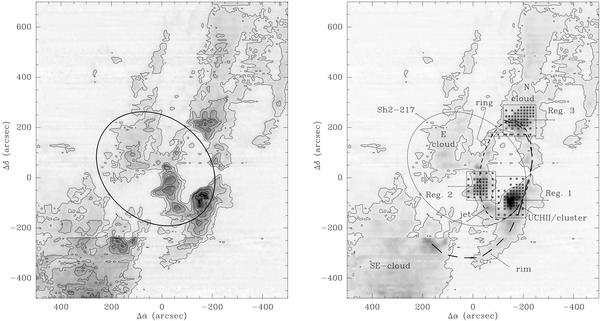
(Left) a) IRAM 30-m, HERA-observations: 12CO(2−1) emission integrated between − 23 and − 15 km s-1. The exciting star of Sh 2-217, coordinates given in Table 1, is at (0, 0). Contour values are from 10 to 100 K km s-1 in steps of 10 K km s-1 (levels ≥ 50 K km s-1 are drawn in white). The ellipse marks the approximate outline of the optically-visible H ii region. The UC H ii region is at offset (−150″, −90″) and coincides with the main peak of the CO-emission. (Right) b) same as the left-panel, but showing only the 10 K km s-1 contour to outline the molecular emission. We have indicated the three regions that were observed in more detail in various molecular tracers (“Reg. 1, 2, 3”; black squares mark observed positions). In projection, these regions appear to form an elliptical structure (marked “ring”; short-dash). Three other structures that are discussed in the text are labeled “N-cloud”, “SE-cloud”, and “E-cloud”. The almost continuous cloud fragment that follows the SW-edge of Sh 2-217, from “Reg. 3” through “Reg. 1” to the CO-peak in the SE-cloud, is labeled “rim” (long-dash). We have also indicated the locations of the jet, the star cluster, and the UCH ii region (see text).
Current usage metrics show cumulative count of Article Views (full-text article views including HTML views, PDF and ePub downloads, according to the available data) and Abstracts Views on Vision4Press platform.
Data correspond to usage on the plateform after 2015. The current usage metrics is available 48-96 hours after online publication and is updated daily on week days.
Initial download of the metrics may take a while.