Free Access
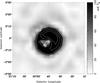
Fig. 2
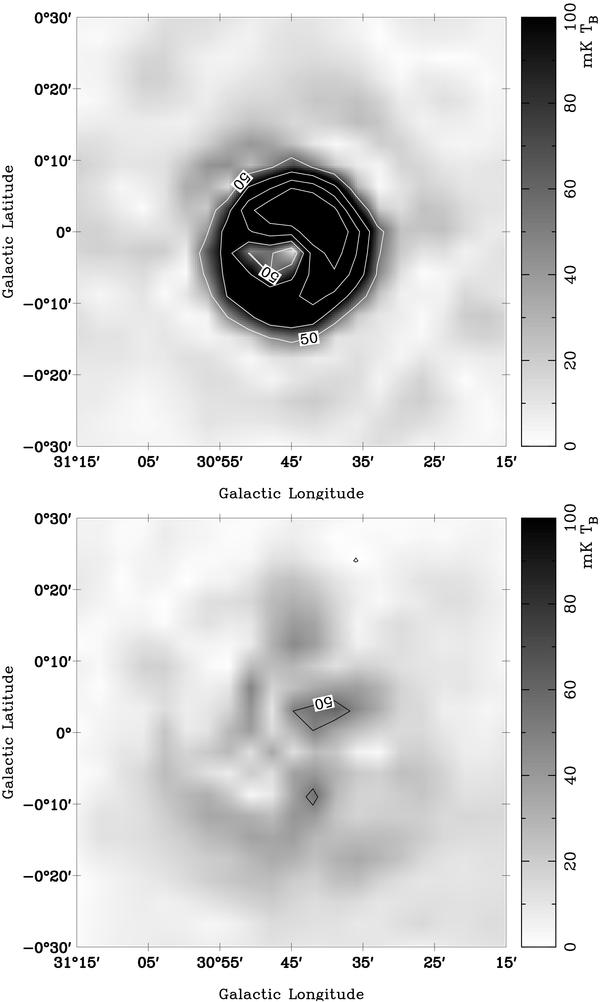
Example of instrumental polarization cleaning applied to the λ6 cm survey polarized intensity data for the case of the H ii region G30.7−0.1. The upper panel shows the original polarized intensity and the lower panel the cleaned map. The contours start at 50 mK TB and increase in steps of 50 mK TB.
This figure is made of several images, please see below:
Current usage metrics show cumulative count of Article Views (full-text article views including HTML views, PDF and ePub downloads, according to the available data) and Abstracts Views on Vision4Press platform.
Data correspond to usage on the plateform after 2015. The current usage metrics is available 48-96 hours after online publication and is updated daily on week days.
Initial download of the metrics may take a while.