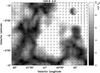
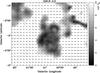
Fig. 17

Polarized intensity maps for the void G40.9 − 4.2. The upper panel shows the original map, the middle panel shows the map with the zero-level restored with a spectral index of βPI = −2.7 according to the restoration model discussed in Sect. 3.1.1. The lower panel shows the map with the zero-level restored using the lowest possible spectral index of βPI = −3.1 (see Fig. 3). PI is always shown in grey scale, and bars indicate polarization B-vectors.

Current usage metrics show cumulative count of Article Views (full-text article views including HTML views, PDF and ePub downloads, according to the available data) and Abstracts Views on Vision4Press platform.
Data correspond to usage on the plateform after 2015. The current usage metrics is available 48-96 hours after online publication and is updated daily on week days.
Initial download of the metrics may take a while.