Fig. 6
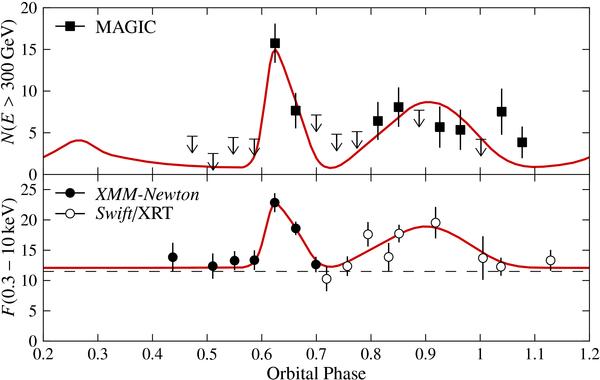
Top: computed VHE light curve (red line) and observed VHE light curve by MAGIC in units of 10-12ph/cm2/s. Observations with a significance above 2σ are shown in filled squares, while 95% CL upper limits are shown otherwise. Bottom: computed X-ray light curve (red line) and X-ray light curve observed during the multiwavelength campaign with XMM–Newton (filled circles) and Swift/XRT (open circles) in units of 10-12erg/cm2/s. The pedestal flux is indicated by a horizontal dashed line. All error bars correspond to 1σ uncertainties. The same parameters as in Fig. 4 are used for both panels.
Current usage metrics show cumulative count of Article Views (full-text article views including HTML views, PDF and ePub downloads, according to the available data) and Abstracts Views on Vision4Press platform.
Data correspond to usage on the plateform after 2015. The current usage metrics is available 48-96 hours after online publication and is updated daily on week days.
Initial download of the metrics may take a while.