Fig. 5
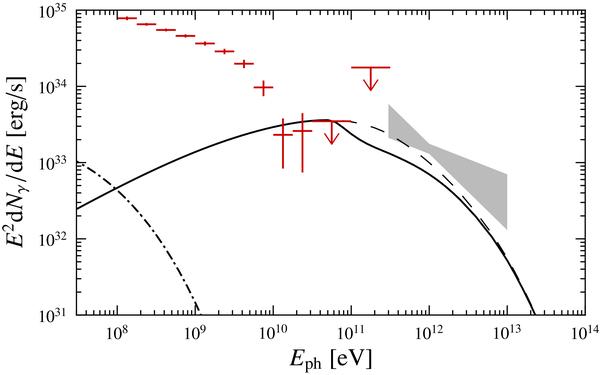
Computed SED averaged over the whole orbit with synchrotron (dot-dashed), IC (solid) and non-absorbed IC (dashed) components, calculated with the same parameters as in Fig. 4. The crosses and upper limits indicate the phase-averaged Fermi/LAT spectrum. The MAGIC VHE spectrum during the outburst is shown as a bow-tie. It must be noted that the MAGIC spectrum corresponds to different phases than the computed SED and is shown as a reference to Fig. 4.
Current usage metrics show cumulative count of Article Views (full-text article views including HTML views, PDF and ePub downloads, according to the available data) and Abstracts Views on Vision4Press platform.
Data correspond to usage on the plateform after 2015. The current usage metrics is available 48-96 hours after online publication and is updated daily on week days.
Initial download of the metrics may take a while.