Fig. 4
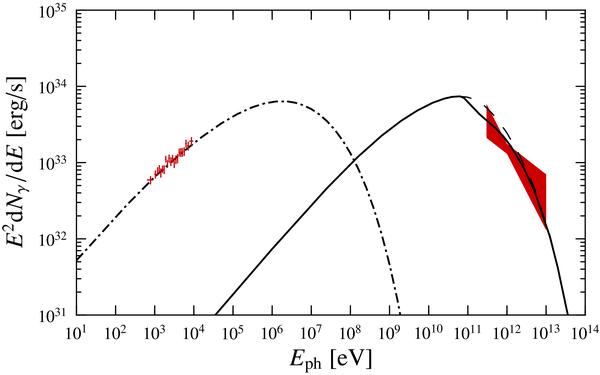
Computed SED averaged over the three observation periods during the first outburst (phases 0.62, 0.66 and 0.70), with synchrotron (dot-dashed), IC (solid) and non-absorbed IC (dashed) components. The calculations were performed with i = 45° and B = 0.22 G. The crosses show the XMM–Newton EPIC-pn spectrum averaged over three observations and deabsorbed taking NH = 5 × 1021 cm-2. To compare the measured flux to the excess computed X-ray flux, we subtracted a pedestal power law spectrum corresponding to a 0.3 − 10 keV flux of 11.5 × 10⁻¹²ergcm-2s-1. The MAGIC simultaneous spectrum is shown as a red bow-tie.
Current usage metrics show cumulative count of Article Views (full-text article views including HTML views, PDF and ePub downloads, according to the available data) and Abstracts Views on Vision4Press platform.
Data correspond to usage on the plateform after 2015. The current usage metrics is available 48-96 hours after online publication and is updated daily on week days.
Initial download of the metrics may take a while.