Fig.9
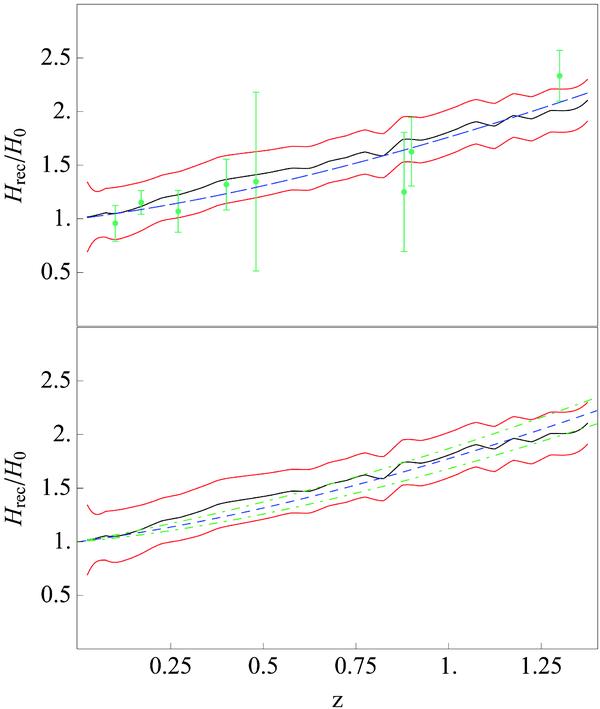
Top: reconstruction of the Huble parameter using four PCs, obtained from the real sample, superimposed on direct Hubble parameter measurements reported by Stern et al. (2010) (green dots). Bottom: reconstruction of H(z) with four PCs and confidence intervals of 2σ obtained from the propagation of statistical uncertainties on Ωm and w reported by Kessler et al. (2009), for MLCS2k2 results. In both panels, the blue dashed line represents H(z) in a flat XCDM cosmological model with w = −0.76 and Ωm = 0.30 (best fit results reported by Kessler et al. 2009). Black curve corresponds to the best-fit reconstruction using 4 PCs and red lines are 2σ confidence levels.
Current usage metrics show cumulative count of Article Views (full-text article views including HTML views, PDF and ePub downloads, according to the available data) and Abstracts Views on Vision4Press platform.
Data correspond to usage on the plateform after 2015. The current usage metrics is available 48-96 hours after online publication and is updated daily on week days.
Initial download of the metrics may take a while.