Fig.8
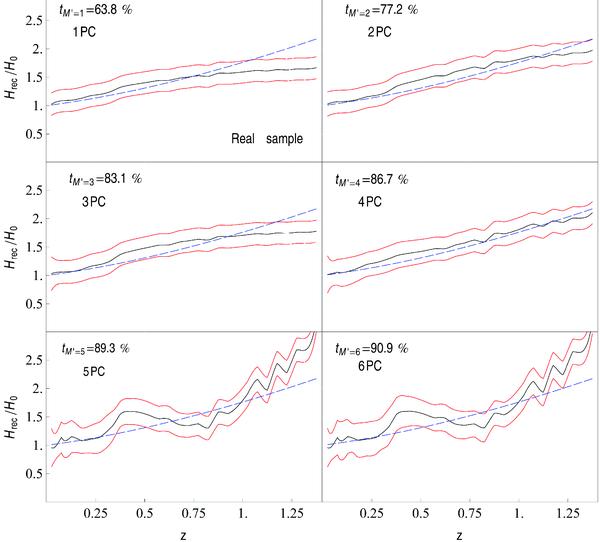
Reconstructions obtained from linear combinations of the PCs shown in Fig. 7. Panels run from 1 (top-left) to 6 (bottom-right) PCs. The blue dashed line represents H(z) in a flat XCDM cosmological model with w = −0.76 and Ωm = 0.30 (best-fit results reported by Kessler et al. 2009). Black curve corresponds to the best-fit reconstruction and red lines are 2σ confidence levels.
Current usage metrics show cumulative count of Article Views (full-text article views including HTML views, PDF and ePub downloads, according to the available data) and Abstracts Views on Vision4Press platform.
Data correspond to usage on the plateform after 2015. The current usage metrics is available 48-96 hours after online publication and is updated daily on week days.
Initial download of the metrics may take a while.