Fig.4
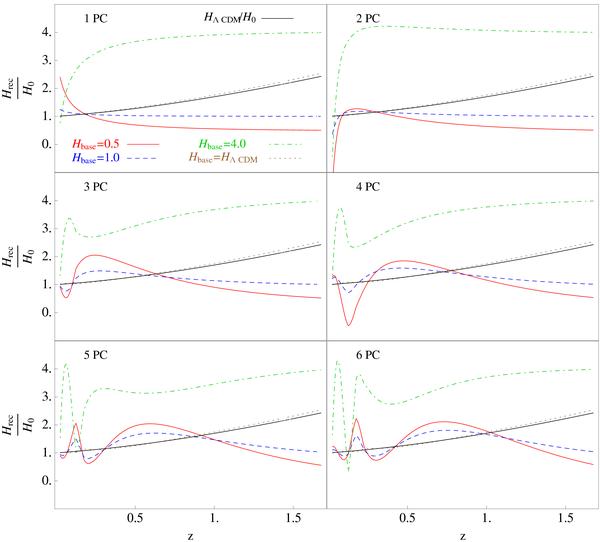
Reconstructions using 1 (top-left) to 6 (right-bottom) PCs for different Hbase, obtained from our mock sample. The black (full) line represents the fiducial model ΛCDM, the brown (dotted) line corresponds to the final reconstructions in the case Hbase(z) = ΛCDM, the red (full) line corresponds to the case Hbase(z) = 0.5, the blue (dashed) line shows the reconstruction considering Hbase = 1.0, and the green (dot-dashed) line is the reconstruction for Hbase(z) = 4.0.
Current usage metrics show cumulative count of Article Views (full-text article views including HTML views, PDF and ePub downloads, according to the available data) and Abstracts Views on Vision4Press platform.
Data correspond to usage on the plateform after 2015. The current usage metrics is available 48-96 hours after online publication and is updated daily on week days.
Initial download of the metrics may take a while.