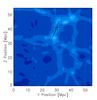
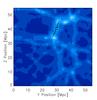
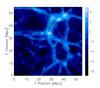
Fig. 1

Distribution of the magnetic field intensity in the region surrounding an ultrahigh energy cosmic-ray source. Each panel is a 1.1 Mpc thick (size of a grid cell) slice of the simulated Universe, cut along the axis perpendicular to the observed plan. From left to right, the distribution is “isotropic” (Eq. (3)), “anisotropic” (Eq. (4)), and “contrasted” (Eq. (5)). The color code is the same for all the panels and the values indicated on the right hand side correspond to the logarithm of the magnetic field intensity in nano-gauss. The black line indicates the axis of the filament that is studied throughout this paper and the black square the chosen position of the source. The normalization factor equals B0 = 1 nG.
Current usage metrics show cumulative count of Article Views (full-text article views including HTML views, PDF and ePub downloads, according to the available data) and Abstracts Views on Vision4Press platform.
Data correspond to usage on the plateform after 2015. The current usage metrics is available 48-96 hours after online publication and is updated daily on week days.
Initial download of the metrics may take a while.