Fig. 7
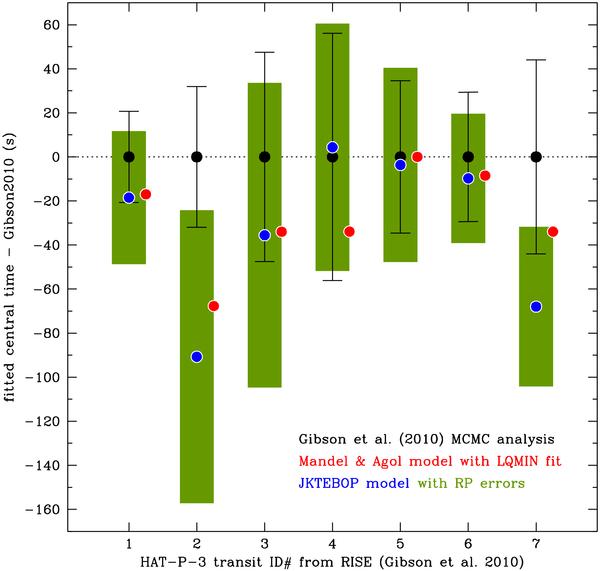
Central times measured on seven light curves of HAT-P-3 collected by Gibson et al. (2010). Comparison between the values published in the original study (black circles and error bars) and those found by our re-analysis with JKTEBOP (blue circles with green error bars from RP algorithm) and a Mandel and Agol model (red circles, slightly displaced on the right for clarity). The numbering of the RISE transits is consistent with Fig. 8.
Current usage metrics show cumulative count of Article Views (full-text article views including HTML views, PDF and ePub downloads, according to the available data) and Abstracts Views on Vision4Press platform.
Data correspond to usage on the plateform after 2015. The current usage metrics is available 48-96 hours after online publication and is updated daily on week days.
Initial download of the metrics may take a while.