Free Access
Fig. 5
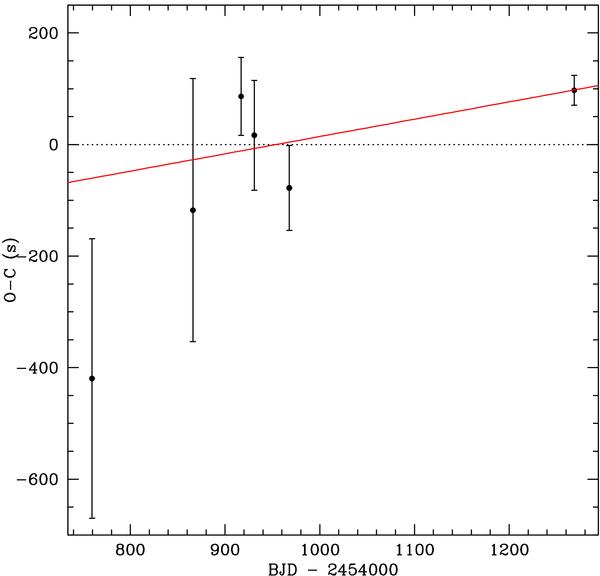
O − C diagram for the central time of the HAT-P-14b transit. The last point is from TASTE (2010, Mar. 12), the others from Torres et al. (2010) from which the C ephemeris is taken. The red line is the weighted fit for our refined ephemeris.
Current usage metrics show cumulative count of Article Views (full-text article views including HTML views, PDF and ePub downloads, according to the available data) and Abstracts Views on Vision4Press platform.
Data correspond to usage on the plateform after 2015. The current usage metrics is available 48-96 hours after online publication and is updated daily on week days.
Initial download of the metrics may take a while.