Free Access
Fig. 3
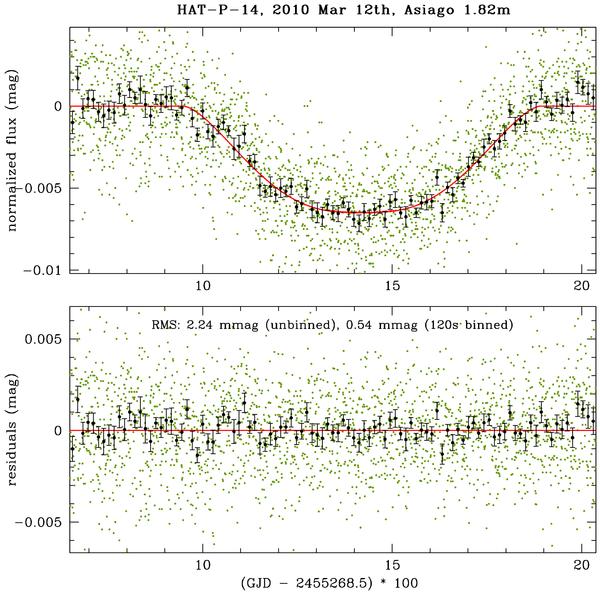
Top: light curve for HAT-P-14b (V ~ 9.98, ΔV = 0.007), observed on March 13, 2010 with the Asiago 1.82 m. Unbinned points are shown in green and 120s-binned points in black. Off-transit magnitude has been set to zero. Bottom: residuals after the best-fit model is subtracted.
Current usage metrics show cumulative count of Article Views (full-text article views including HTML views, PDF and ePub downloads, according to the available data) and Abstracts Views on Vision4Press platform.
Data correspond to usage on the plateform after 2015. The current usage metrics is available 48-96 hours after online publication and is updated daily on week days.
Initial download of the metrics may take a while.