| Issue |
A&A
Volume 527, March 2011
|
|
|---|---|---|
| Article Number | A147 | |
| Number of page(s) | 5 | |
| Section | Extragalactic astronomy | |
| DOI | https://doi.org/10.1051/0004-6361/201015139 | |
| Published online | 14 February 2011 | |
Radial migration in galactic disks caused by resonance overlap of multiple patterns: Self-consistent simulations
1
AIP, An der Sterwarte 16,
14482
Potsdam,
Germany
2
Observatoire Astronomique de Strasbourg, CNRS UMR 7550,
67000
Strasbourg,
France
e-mail: ivan.minchev@astro.unistra.fr
3
AIfA, Universtät Bonn, 53121
Bonn,
Germany
4
Observatoire de Paris, LERMA, 61 avenue de L’Observatoire,
75014
Paris,
France
5
Observatoire de Paris-Meudon, GEPI, CNRS UMR 8111,
5 pl. Jules
Janssen, 92195
Meudon,
France
6
ARI, Liverpool John Moores University,
Twelve Quays House, Egerton
Wharf, Birkenhead,
CH41 1LD,
UK
Received:
2
June
2010
Accepted:
7
December
2010
We have recently identified a new radial migration mechanism resulting from the overlap of spiral and bar resonances in galactic disks. Here we confirm the efficiency of this mechanism in fully self-consistent, Tree-SPH simulations, as well as high-resolution pure N-body simulations. In all barred cases we clearly identify the effect of spiral-bar resonance overlap by measuring a bimodality in the changes of angular momentum in the disk, ΔL, whose maxima are near the bar’s corotation and outer Lindblad resonance. This contrasts with the smooth distribution of ΔL for a simulation with no stable bar present, where strong radial migration is induced by multiple spirals. The presence of a disk gaseous component appears to increase the rate of angular momentum exchange by about 20%. The efficiency of this mechanism is such that galactic stellar disks can extend to over 10 scale-lengths within 1–3 Gyr in both Milky Way size and low-mass galaxies (circular velocity ~100 km s-1). We also show that metallicity gradients can flatten in less than 1 Gyr rendering mixing in barred galaxies an order of magnitude more efficient than previously thought.
Key words: galaxies: evolution / galaxies: kinematics and dynamics / galaxies: abundances / galaxies: spiral
© ESO, 2011
1. Introduction
In the past few decades, discrepancies in the solar neighborhood age-metallicity relation have implied that effective radial migration (i.e., redistribution of angular momentum) must be taking place in the Milky Way disk (Edvardsson et al. 1993; Haywood 2008; Schönrich & Binney 2009; see Minchev & Famaey 2010, for a comprehensive discussion). In parallel, there is now considerable observational evidence that the non-axisymmetry of the Galactic potential can cause significant perturbations in the motion of stars of all ages. Evidence for this comes from, e.g., the moving groups in the solar neighbourhood (Dehnen 1998) containing stars of very different ages (Famaey et al. 2005) or the non-zero value of the C and K Oort constants for red giant stars in the extended local disk (Olling & Dehnen 2003; Siebert et al. 2010). All of these can be explained by the effect of resonances associated with a central bar (Minchev et al. 2010, 2007) or spiral structure (SS) (Quillen & Minchev 2005; Quillen et al. 2010).
Until recently it was accepted that efficient radial mixing of stars in galactic disks was caused solely by transient spirals (Sellwood & Binney 2002, hereafter SB02). However, Quillen et al. (2009) showed that small satellites on radial, in-plane orbits can cause mixing in the outer disk and thus account for the fraction of low-metallicity stars present in the solar neighborhood (Haywood 2008). Moreover, we have recently demonstrated (Minchev & Famaey 2010, hereafter MF10) that a strong exchange of angular momentum occurs when a stellar disk is perturbed by a central bar and SS simultaneously: our test-particle simulations allowed us to attribute this effect to the overlap or first and second order resonances of each perturber. The presence of multiple patterns in galactic disks has been observed both in external galaxies (e.g., Elmegreen et al. 1992) and N-body simulations (e.g., Rautiainen & Salo 1999). Given that more than two-thirds of disk galaxies, including our own Milky Way, contain both central bars and SS, it is imperative to establish a strong understanding of the implications of this mechanism. Therefore, in this work we study a range of fully self-consistent, Tree-SPH simulations, as well as high resolution pure N-body simulations, searching for the signature of spiral-bar interaction in the distribution of angular momentum: MF10 predicted that when both bar and spirals are present in the disk, one finds that the changes in angular momentum form a bimodal distribution, with two local maxima close to the corotation and outer Lindblad resonance of the bar, regardless of the pattern speed of the spiral.
2. Models and results
While not self-consistent, test-particle simulations allow for a full control over the simulation parameters, such as the amplitudes and pattern speeds of bar and SS, and still provide a good approximation to self-consistent simulations. Employing this method in MF10, we were able to suppress the effect of transient spirals and thus identify the non-linear effect of resonance overlap. We showed that the most important signature of this mechanism was a bimodality in the changes in angular momentum in the disk, ΔL, with maxima near the bar’s corotation and its outer Lindblad resonance (OLR) regardless of the SS pattern speed.
Hereafter, we analyze self-consistent simulations with strong bars and spirals, therefore mixing from both transient spirals (SB02) and resonance overlap (MF10) is expected. However, we hope to be able to identify the latter mechanism by detecting the aforementioned bimodality, given that the predicted distribution of ΔL generated by transient spirals without a bar is rather smooth and not bimodal (see SB02).
 |
Fig. 1 First row: stellar disk number density contours of the isolated giant Sa galaxy simulation in GalMer for 5 time outputs as indicated in each panel. Second row: changes in angular momentum, ΔL as a function of the initial angular momentum, L. Both ΔL and L are divided by the asymptotic circular velocity Vc, thus L gives approximately the galactic radius in kpc. The locations of the bar’s corotation and 2:1 OLR are indicated by the dotted and solid lines, respectively. A bimodal distribution indicating the work of resonance overlap of bar and spirals is clearly seen in each panel. Third row: the evolution of the radial profiles (left) and metallicities (right) for the stellar and gaseous disks. The initial stellar and gaseous disk scale-lengths are indicated by the dashed lines. The time steps shown are as in the first row, indicated by solid red, dotted orange, dashed green, dotted-dash blue, and solid purple lines, respectively. Fourth row: distribution of birth radii for stars ending up in the annuli indicated by the green lines (600 pc) at t = 2.5 Gyr. |
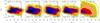 |
Fig. 2 Same as the second row of Fig. 1 but for all isolated giant GalMer galaxies. Contour levels are the same for all plots and the time is t = 1 Gyr. The locations of the bar’s corotation and OLR are indicated by the dotted and solid lines, respectively. The rightmost panel shows the only disk lacking a central bar. In this case, resonance overlap from strong multiple spirals gives rise to a smooth ΔL distribution. |
2.1. Tree-SPH simulation of a giant Sa spiral galaxy
We test the predictions of MF10 by analyzing fully self-consistent simulations of isolated disk galaxies from the GalMer database1, including a gas component as well as star formation (Di Matteo et al. 2007; Chilingarian et al. 2010).
In Galmer, for each galaxy type, the halo and the optional bulge are modeled as Plummer
spheres, with characteristic masses MH and
MB, and characteristic radii rH
and rB, respectively. Their densities are given by:
 (1)and
 (2)On the other hand, the
gaseous and stellar disks follow Miyamoto-Nagai density profiles with masses
Mg and M∗ and vertical and
radial scale lengths given, respectively, by hg and
ag, and h∗ and
a∗:
(2)On the other hand, the
gaseous and stellar disks follow Miyamoto-Nagai density profiles with masses
Mg and M∗ and vertical and
radial scale lengths given, respectively, by hg and
ag, and h∗ and
a∗: ![\begin{eqnarray} \label{gasdisk} \rho_{\rm g}(R,z)&=&\left(\frac{{h_{\rm g}}^2 M_{\rm g}}{4 \pi}\right)\nonumber\\&&\times\frac{a_{\rm g} R^2+(a_{\rm g}+3\sqrt{z^2+{h_{\rm g}}^2})\left(a_{\rm g}+\sqrt{z^2+{h_{\rm g}}^2}\right)^2} {\left[a_{\rm g}^2+\left(a_{\rm g}+\sqrt{z^2+{h_{\rm g}}^2}\right)^2\right]^{5/2}\left(z^2+{h_{\rm g}}^2\right)^{3/2}}, \\ \label{stdisk} \rho_{*}(R,z)&=&\left(\frac{{h_{*}}^2 M_{*}}{4 \pi}\right)\nonumber\\&&\times\frac{a_{*} R^2+(a_{*}+3\sqrt{z^2+{h_{*}}^2})\left(a_{*}+\sqrt{z^2+{h_{*}}^2}\right)^2} {\left[a_{*}^2+\left(a_{*}+\sqrt{z^2+{h_{*}}^2}\right)^2\right]^{5/2}\left(z^2+{h_*}^2\right)^{3/2}}\cdot \end{eqnarray}](/articles/aa/full_html/2011/03/aa15139-10/aa15139-10-eq22.png) Here,
we first analyze the properties of the isolated giant Sa (gSa) galaxy model: it has a
total mass of ~2.4 × 10¹¹ M⊙, with
MH = 1.15 × 10¹¹ M⊙,
MB = 0.23 × 10¹¹ M⊙,
Mg = 0.09 × 10¹¹ M⊙,
and
M∗ = 0.92 × 10¹¹ M⊙.
The scale radii are rH = 10 kpc,
rB = 2 kpc, hg = 0.2 kpc,
ag = 5 kpc, h∗ = 0.5 kpc, and
a∗ = 4 kpc. The initial Toomre parameter of both stars and
gas is taken to be Q = 1.2 as the initial condition of the Tree-SPH
simulations. Figure 1 shows the properties of this
isolated gSa model as a function of time.
Here,
we first analyze the properties of the isolated giant Sa (gSa) galaxy model: it has a
total mass of ~2.4 × 10¹¹ M⊙, with
MH = 1.15 × 10¹¹ M⊙,
MB = 0.23 × 10¹¹ M⊙,
Mg = 0.09 × 10¹¹ M⊙,
and
M∗ = 0.92 × 10¹¹ M⊙.
The scale radii are rH = 10 kpc,
rB = 2 kpc, hg = 0.2 kpc,
ag = 5 kpc, h∗ = 0.5 kpc, and
a∗ = 4 kpc. The initial Toomre parameter of both stars and
gas is taken to be Q = 1.2 as the initial condition of the Tree-SPH
simulations. Figure 1 shows the properties of this
isolated gSa model as a function of time.
2.1.1. Identification of the bimodality
In the first row of Fig. 1, we plot stellar number density contours for five time outputs up to 3 Gyr as indicated in each panel. We note that the initially strong SS disappears by the end of the simulation. The expansion of the disk is already an indication of radial migration.
The second row of Fig. 1 shows contours of the changes in the angular momentum of stars, ΔL, versus the initial angular momentum, L0. Both ΔL and L are divided by the asymptotic circular velocity Vc ≈ 280 km s-1, thus L gives approximately the galactic radius in kpc. The bar’s corotation and 2:1 OLR are indicated by the dotted and solid lines. A bimodal distribution becomes apparent as soon as the bar and SS form (t ≈ 0.2 Gyr). While the peak at L0 ≈ 4.5 is caused by the bar’s corotation, the one at L0 ≈ 8.5 could only be produced by resonance overlap (see Fig. 2 in MF10). At all later times this clear bimodality remains in the distribution of ΔL, thus providing strong evidence that the effect we see is caused by the spiral-bar interaction. We note also that the mixing timescale here is simply too short to be the effect of transients only.
2.1.2. Extension of the disk
The third row of Fig. 1 shows the temporal evolution of the radial density (left) and metallicity (right) profiles for both the stellar and gaseous disks. The time steps shown are as in the first row, indicated by solid red, dotted orange, dashed green, dotted-dash blue, and solid purple in increasing order.
Owing to the vigorous mixing, the disk grows rapidly with time displaying a break in the density profile that moves progressively to larger radii. At the final time (purple lines), the stellar and gaseous disks have extended to about ten and seven scale-lengths, respectively, while roughly preserving their exponential profiles. This is accompanied by a strong flattening in the metallicity gradients, where at t = 3 Gyr one can clearly see a reversal in the metallicity gradient of stars in the outer region of the disk (~30 kpc). The stellar metallicities at that location are similar to the initial ones at 8 kpc, suggesting that stars in the outskirts of the disk originate from regions near the bar’s 2:1 OLR, where the changes in ΔL are most prominent.
2.1.3. Birth radii of stars
The bottom row of Fig. 1 shows the distribution of birth radii for stars ending up in the annuli indicated by the green lines (600 pc) at t = 2.5 Gyr. The black and red histograms show stars on nearly circular orbits (of velocity dispersion smaller than 10 km s-1) and the total population, respectively. In all cases, a large fraction of stars are found to originate from the bar’s corotation (dotted line), as well as an increasingly large fraction from the bar’s OLR (solid line) as larger final radii are sampled.
2.2. Tree-SPH simulations of other galaxy types
To assess how our results depend on the peculiar galaxy type we considered, we plot in Fig. 2 the changes in angular momentum for the stellar disk components of all GalMer isolated giant galaxy models available (Chilingarian et al. 2010, Table 1). Contour levels are the same for all plots and the time is t = 1 Gyr. All apart from the gSd (bulgeless) model develop long-lived, central bars at the beginning of the simulation and consequently show a bimodality in ΔL. When we compare the gS0 and gSa models, which have identical initial conditions except that gS0 is gas-free, we find that ΔL increases by ~20% when gaseous disk component is introduced. The stability of the gas, however, does not appear to play a major role. Only a small difference occurs when the gas is made more unstable when Qgas is lowered from 1.2 to 0.3 (second and third panels), where Qgas is the Toomre instability parameter for the gas. The weaker bar in the gSb model (fourth panel) results in reduced mixing as we predicted in MF10. Unlike all other models, the gSd simulation (rightmost panel) does not form a stable bar. The strong mixing observed here results from the large number of multiple spirals (Elmegreen et al. 1992; Rix & Rieke 1993; Minchev & Quillen 2006) propagating simultaneously through the disk during the first ~500 Myr. Due to the various SS pattern speeds, there are no radii at which the effect of resonance overlap differs distinctly from the rest of the disk (such as the bar’s corotation and OLR). Consequently, we observe a smooth distribution of ΔL in contrast to the case of bar + SS.
 |
Fig. 3 Power spectrum displaying the pattern speed of the m = 2 and m = 4 Fourier components, during the entire simulation, of the gSa (top) and gSb (bottom) models. Contour levels are indicated for each panel. Note that the gSa bar evolves (slows down and extends) much more and its two-armed SS is twice as strong as for the gSb model (top left). Despite the slightly stronger gSb bar, the effect on ΔL in the gSa’s outer disk is much more prominent (Fig. 2) because of the combined effect of the bar and stronger spirals. |
2.3. Pattern speeds
Figure 3 shows a power spectrum displaying the pattern speeds of the m = 2 and m = 4 (two-armed and four-armed structure) Fourier components, over the whole simulation, of the gSa (top) and gSb (bottom) models. Contour levels are indicated for each panel in units of QT, the ratio of the maximum tangential force to the azimuthally averaged radial force at a given radius. For both simulations, the SS (r ≳ 5 kpc) spans a range of pattern speeds, always slower than the bar. As expected from the results of MF10, the SS pattern speed has little influence on the location of the maxima in the bimodal distribution of ΔL. Note that the gSa bar evolves (slows down and extends over time) much more, and that its two-armed SS is twice stronger compared to the gSb model (top left). Despite the slightly stronger gSb bar, the effect on ΔL for the gSa is much more prominent in the outer disk (Fig. 2) because of the combined effect of the bar and stronger spirals. Strong spirals are thus needed for this migration mechanism to be efficient. However, the relation between the strength of the perturbers and the angular momentum redistribution is nonlinear as previously shown by MF10.
 |
Fig. 4 Contrasting the effect on ΔL for a low-resolution (1.27 × 10⁵) and a high-resolution 107 pure N-body simulations. |
2.4. High resolution N-body simulations
To determine whether the strong mixing we described above is caused by a deficiency in the resolution of the GalMer simulations, we ran pure N-body collisionless simulations with 107 and 1.27 × 10⁵ particles in the disk. Full description and details can be found in Wozniak & Michel-Dansac (2009). With a scale-length of 3.5 kpc, the initial conditions of the disk are comparable to those of the gSb GalMer model (Fig. 2) but lack a gas component. These simulations have no halo, which causes a ~30% drop in the RC at ~10 kpc.
Figure 4 shows the changes in angular momentum at t = 1 and 3 Gyr for 1.27 × 10⁵ (top) and 107 (bottom) disk particles. At the beginning of the simulations, the effect is stronger for the low-resolution case due to the faster bar formation. However, at t ≈ 2 Gyr both the high- and low-resolution runs yield a similar result. This suggests that the magnitude of the radial migration induced by the bar-spiral interaction and the timescale over which it is effective are not strongly dependent on the numerical resolution of the simulations. We conclude that the properties of the mixing, i.e., its magnitude and timescale, that we infer from the GalMer simulations are only weakly affected by the insufficient resolution.
2.5. Migration in low-mass galaxies
We now investigate whether the resonance overlap mechanism is also efficient in low-mass galaxies. Gogarten et al. (2010) showed that although transient spirals can explain extended disks for MW-type galaxies, this mixing mechanism is inefficient for galaxies with RCs of Vc ~ 100 km s-1, such as NGC 300 and M 33. Nevertheless, both NGC 300 and M 33 are observed to have extended radial profiles of up to ten scale-lengths. We now consider the barred, dwarf Sa (dSa) simulation in GalMer (RC of 100 km s-1 and initial scale-length of 1.3 kpc) to see how its density distribution and metallicity gradient evolve with time. In Fig. 5 we plot the time development of the stellar disk density and metallicity profiles, for the same time steps as in Fig. 1. We can clearly see that the stellar disk extends to more than ten scale-lengths in ~3 Gyr, while preserving its exponential mass density profile. At the same time, the metallicity gradient becomes flat in less than 1 Gyr. Both the predicted extent of the stellar disk and the flattening of the metallicity profile are consistent with what has been recently reported for nearby low-mass galaxies (Bland-Hawthorn et al. 2005; Vlajić et al. 2009).
 |
Fig. 5 The time evolution of the stellar disk density (left) and metallicity (right) profiles for the dwarf Sa isolated GalMer model. Time outputs and colors are the same as the third row of Fig. 1. This is a low-mass galaxy with a rotation curve of ~100 km s-1 similar to NGC 300 and M 33. The initial disk scale-length is indicated by the dashed line. The disk extends to over ten scale-lengths in less than 3 Gyr. |
3. Conclusions
We have examined the redistribution of angular momentum in galactic disks by means of Tree-SPH and high-resolution pure N-body simulations. We have found that resonance overlap of multiple patterns (such as bar + SS or SS + SS) induces strong exchange of angular momentum throughout the disks in agreement with the predictions of MF10. Since in the self-consistent simulations analyzed in this work spirals may be transient, we should also expect a contribution from the SB02 radial migration mechanism. However, for the short timescales considered here (<1 Gyr) transients would simply have a very small effect (SB02). The resonance overlap mechanism is clearly identified by a bimodality in the changes in angular momentum, ΔL, caused by the bar’s corotation and 2:1 OLR (Figs. 1, 2, and 4). We have contrasted this to a simulation lacking a stable central bar (Fig. 2, rightmost panel), where the ΔL distribution is smooth. The effect is especially strong when a gaseous component is present, as a result of the exchange of L between gas and stars coming from the gravity torques, the phase shift between the two components, and the gas dissipation (Bournaud & Combes 2002). Depending on the amount of gas and the strength of the bars and spirals, the metallicity gradients can flatten in less than 1 Gyr (Fig. 1). This is in drastic contrast to the current understanding that galactic disks need a Hubble time for sufficient mixing (SB02, Roškar et al. 2008).
How can we tie our results to galactic disk evolution? Bournaud & Combes (2002) followed the detailed processes of bar formation, bar destruction, and bar re-formation, while varying the disk to bulge ratio. These authors identified three bar formation episodes in a Hubble time. In this model, we can
regard a given GalMer isolated galaxy simulation as one such episode of a gas accretion event during a galaxy lifetime. In this scenario, the rapid flattening of the metallicity gradients expected from the vigorous migration (Fig. 1) would be followed by a gas enrichment at each bar re-formation event resulting in the rebuilding of the gradient. The presence or not of a metallicity gradient, or its intensity, would then be an indicator of the bar/accretion phase of the galaxy.
The mechanism described in this study works even in low-mass galaxies (Fig. 5) and can thus for the first time provide an explanation for the extended disk profiles observed in galaxies with Vc ~ 100 km s-1 (Bland-Hawthorn et al. 2005; Minchev et al., in prep.).
Acknowledgments
We would like to thank Alice Quillen, Cristina Chiappini, Ken Freeman and Joss Bland-Hawthorn for their valuable comments. Support for this work was provided by ANR-CNRS, and the AvH foundation.
References
- Bland-Hawthorn, J., Vlajić, M., Freeman, K. C., & Draine, B. T. 2005, ApJ, 629, 239 [NASA ADS] [CrossRef] [Google Scholar]
- Bournaud, F., & Combes, F. 2002, A&A, 392, 83 [NASA ADS] [CrossRef] [EDP Sciences] [Google Scholar]
- Chilingarian, I., Di Matteo, P., Combes, F., Melchior, A., & Semelin, B. 2010, A&A, 518, A61 [NASA ADS] [CrossRef] [EDP Sciences] [Google Scholar]
- Dehnen, W. 1998, AJ, 115, 2384 [NASA ADS] [CrossRef] [Google Scholar]
- Di Matteo, P., Combes, F., Melchior, A., & Semelin, B. 2007, A&A, 468, 61 [NASA ADS] [CrossRef] [EDP Sciences] [Google Scholar]
- Edvardsson, B. 1993, A&A, 275, 101 [NASA ADS] [Google Scholar]
- Elmegreen, B. G., Elmegreen, D. M., & Montenegro, L. 1992, ApJS, 79, 37 [NASA ADS] [CrossRef] [Google Scholar]
- Famaey, B., Jorissen, A., Luri, X., et al. 2005, A&A, 430, 165 [NASA ADS] [CrossRef] [EDP Sciences] [Google Scholar]
- Gogarten, S. M. 2010, ApJ, 712, 858 [NASA ADS] [CrossRef] [Google Scholar]
- Haywood, M. 2008, MNRAS, 388, 1175 [NASA ADS] [CrossRef] [Google Scholar]
- Minchev, I., & Quillen, A. C. 2006, MNRAS, 368, 623 [NASA ADS] [CrossRef] [Google Scholar]
- Minchev, I., & Famaey, B. 2010, ApJ, 722, 112 (MF10) [NASA ADS] [CrossRef] [Google Scholar]
- Minchev, I., Nordhaus, J., & Quillen, A. C. 2007, ApJ, 664, L31 [NASA ADS] [CrossRef] [Google Scholar]
- Minchev, I., Boily, C., Siebert, A., & Bienayme, O. 2010, MNRAS, 407, 2122 [NASA ADS] [CrossRef] [MathSciNet] [Google Scholar]
- Olling, R., & Dehnen, W. 2003, ApJ, 599, 275 [NASA ADS] [CrossRef] [Google Scholar]
- Quillen, A. C., & Minchev, I. 2005, AJ, 130, 576 [NASA ADS] [CrossRef] [Google Scholar]
- Quillen, A. C., Minchev, I., Bland-Hawthorn, J., & Haywood, M. 2009, MNRAS, 397, 1599 [NASA ADS] [CrossRef] [Google Scholar]
- Quillen, A. C., Dougherty, J., Bagley, M. B., Minchev, I., & Comparetta, J. 2010, MNRAS, submitted [arXiv:1010.5745] [Google Scholar]
- Rautiainen, P., & Salo, H. 1999, A&A, 348, 737 [NASA ADS] [Google Scholar]
- Rix, H., & Rieke, M. J. 1993, ApJ, 418, 123 [NASA ADS] [CrossRef] [Google Scholar]
- Roškar, R., Debattista, V. P., Quinn, T. R., Stinson, G. S., & Wadsley, J. 2008, ApJ, 684, L79 [NASA ADS] [CrossRef] [Google Scholar]
- Schönrich, R., & Binney, J. 2009, MNRAS, 396, 203 [NASA ADS] [CrossRef] [Google Scholar]
- Sellwood, J. A., & Binney, J. J. 2002, MNRAS, 336, 785 [NASA ADS] [CrossRef] [Google Scholar]
- Siebert, A., Famaey, B., Minchev, I., et al. 2011, MNRAS, accepted [arXiv:1011.4092] [Google Scholar]
- Vlajić, M., Bland-Hawthorn, J., & Freeman, K. C. 2009, ApJ, 697, 361 [NASA ADS] [CrossRef] [Google Scholar]
- Wozniak, H., & Michel-Dansac, L. 2009, A&A, 494, 11 [NASA ADS] [CrossRef] [EDP Sciences] [Google Scholar]
All Figures
|
Fig. 1 First row: stellar disk number density contours of the isolated giant Sa galaxy simulation in GalMer for 5 time outputs as indicated in each panel. Second row: changes in angular momentum, ΔL as a function of the initial angular momentum, L. Both ΔL and L are divided by the asymptotic circular velocity Vc, thus L gives approximately the galactic radius in kpc. The locations of the bar’s corotation and 2:1 OLR are indicated by the dotted and solid lines, respectively. A bimodal distribution indicating the work of resonance overlap of bar and spirals is clearly seen in each panel. Third row: the evolution of the radial profiles (left) and metallicities (right) for the stellar and gaseous disks. The initial stellar and gaseous disk scale-lengths are indicated by the dashed lines. The time steps shown are as in the first row, indicated by solid red, dotted orange, dashed green, dotted-dash blue, and solid purple lines, respectively. Fourth row: distribution of birth radii for stars ending up in the annuli indicated by the green lines (600 pc) at t = 2.5 Gyr. |
| In the text | |
|
Fig. 2 Same as the second row of Fig. 1 but for all isolated giant GalMer galaxies. Contour levels are the same for all plots and the time is t = 1 Gyr. The locations of the bar’s corotation and OLR are indicated by the dotted and solid lines, respectively. The rightmost panel shows the only disk lacking a central bar. In this case, resonance overlap from strong multiple spirals gives rise to a smooth ΔL distribution. |
| In the text | |
|
Fig. 3 Power spectrum displaying the pattern speed of the m = 2 and m = 4 Fourier components, during the entire simulation, of the gSa (top) and gSb (bottom) models. Contour levels are indicated for each panel. Note that the gSa bar evolves (slows down and extends) much more and its two-armed SS is twice as strong as for the gSb model (top left). Despite the slightly stronger gSb bar, the effect on ΔL in the gSa’s outer disk is much more prominent (Fig. 2) because of the combined effect of the bar and stronger spirals. |
| In the text | |
|
Fig. 4 Contrasting the effect on ΔL for a low-resolution (1.27 × 10⁵) and a high-resolution 107 pure N-body simulations. |
| In the text | |
|
Fig. 5 The time evolution of the stellar disk density (left) and metallicity (right) profiles for the dwarf Sa isolated GalMer model. Time outputs and colors are the same as the third row of Fig. 1. This is a low-mass galaxy with a rotation curve of ~100 km s-1 similar to NGC 300 and M 33. The initial disk scale-length is indicated by the dashed line. The disk extends to over ten scale-lengths in less than 3 Gyr. |
| In the text | |
Current usage metrics show cumulative count of Article Views (full-text article views including HTML views, PDF and ePub downloads, according to the available data) and Abstracts Views on Vision4Press platform.
Data correspond to usage on the plateform after 2015. The current usage metrics is available 48-96 hours after online publication and is updated daily on week days.
Initial download of the metrics may take a while.