Fig. 6
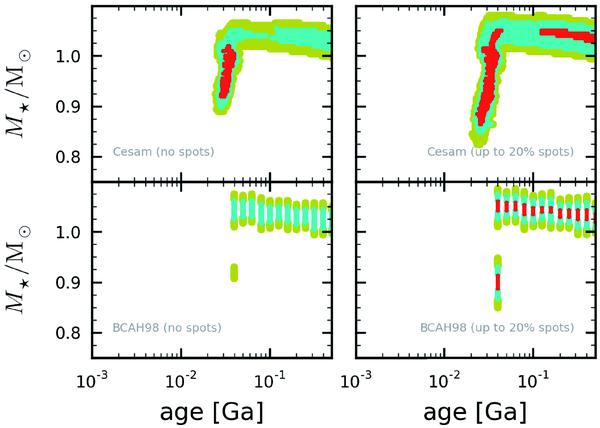
Constraints obtained for the age as a function of mass of CoRoT-2. The left panels correspond to results obtained by neglecting the effect of spots. The right panels assume an additional uncertainty in the derived Teff because of the presence of up to 20% of spots. The upper panels are calculated from CESAM evolution tracks. The lower panels are calculated from BCAH98 evolution tracks. Colors have the same meaning as in Fig. 5.
Current usage metrics show cumulative count of Article Views (full-text article views including HTML views, PDF and ePub downloads, according to the available data) and Abstracts Views on Vision4Press platform.
Data correspond to usage on the plateform after 2015. The current usage metrics is available 48-96 hours after online publication and is updated daily on week days.
Initial download of the metrics may take a while.