Fig. 2
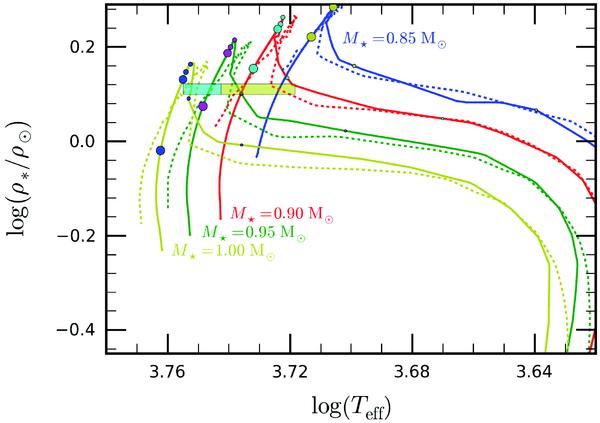
Evolution tracks for stars of masses between 0.85 and 1.0 M⊙ in the effective temperature vs. stellar density space. The 1σ observational constraints are shown as boxes: the box to the left (blue) corresponds to solutions that neglect the effect of spots. The two boxes (blue and yellow) correspond to the added uncertainty obtained when assuming that from 0 to 20% of the stellar surface is covered by spots. CESAM tracks (plain) are compared to BCAH98 tracks (dashed). The models assume solar composition. Dots on the CEPAM tracks correspond to the following ages (small to large circles): 20, 32, 100, 500, 1000, 5000 Ma, respectively.
Current usage metrics show cumulative count of Article Views (full-text article views including HTML views, PDF and ePub downloads, according to the available data) and Abstracts Views on Vision4Press platform.
Data correspond to usage on the plateform after 2015. The current usage metrics is available 48-96 hours after online publication and is updated daily on week days.
Initial download of the metrics may take a while.