Fig. 16
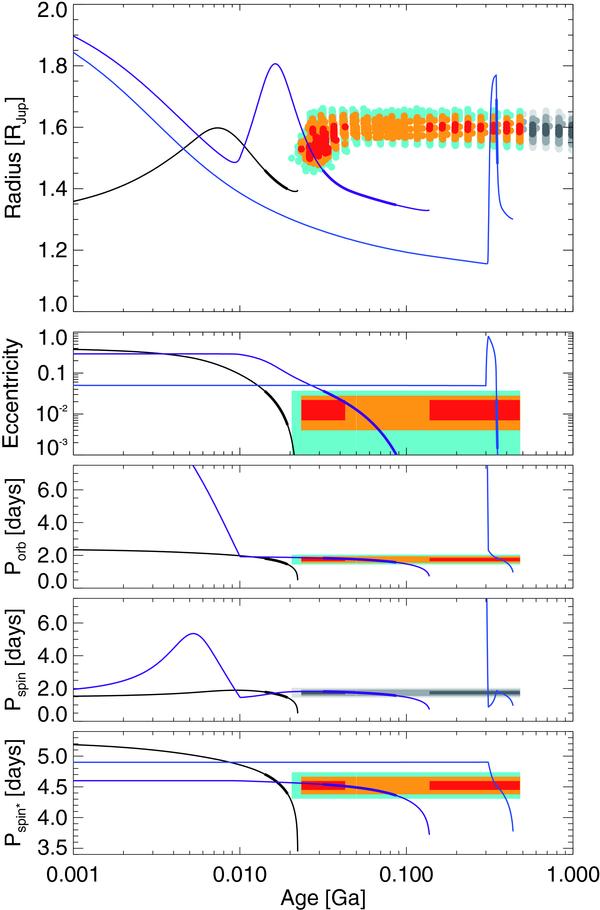
Evolution of the CoRoT-2 system in the presence of tides, as a function of age
expressed in billion years. From top to bottom, the five panels
are: a) planet’s transit radius; b) planet’s orbital
eccentricity; c) planet’s orbital period in days; d)
planet’s spin period in days; e) star’s spin period in days. The
observational constraints are indicated by colored areas (see Fig. 12). For visibility purposes, the constraint on
the orbital period has been increased by a factor 105. Three models are
shown: Black lines: a model with
 ,
,
 ,
eini = 0.4,
aini = 0.04 AU, corresponding to a preferred model of
Gillon et al. (2010). Purple
lines: a model including migration for the first 10 Ma, and
,
eini = 0.4,
aini = 0.04 AU, corresponding to a preferred model of
Gillon et al. (2010). Purple
lines: a model including migration for the first 10 Ma, and
 ,
,
 ,
eini = 0.4,
aini = 0.13 AU. Blue lines: a
close-encounter model, for which the eccentricity is suddenly raised to
e ~ 0.77 after 300 Ma, presumably due to close
encounters with another planet. This assumes
,
eini = 0.4,
aini = 0.13 AU. Blue lines: a
close-encounter model, for which the eccentricity is suddenly raised to
e ~ 0.77 after 300 Ma, presumably due to close
encounters with another planet. This assumes  ,
,
aini = 0.1 AU. The thick parts of the lines
corresponds to epochs for which the eccentricity and orbital periods are in
agreement with the observations (see text).
,
,
aini = 0.1 AU. The thick parts of the lines
corresponds to epochs for which the eccentricity and orbital periods are in
agreement with the observations (see text).
Current usage metrics show cumulative count of Article Views (full-text article views including HTML views, PDF and ePub downloads, according to the available data) and Abstracts Views on Vision4Press platform.
Data correspond to usage on the plateform after 2015. The current usage metrics is available 48-96 hours after online publication and is updated daily on week days.
Initial download of the metrics may take a while.