Fig. 12
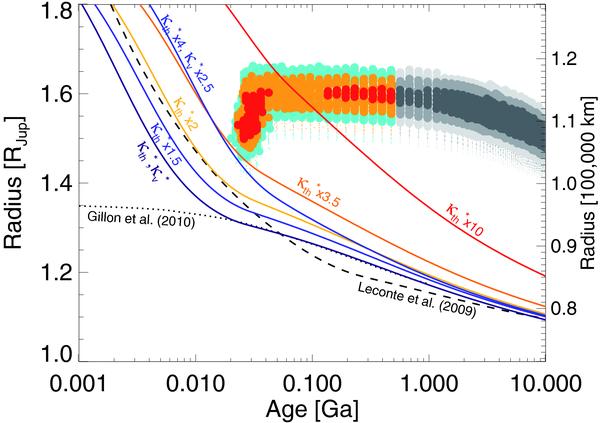
Transit radius of CoRoT-2b as a function of age. The colored areas indicate constraints obtained from photometric, spectroscopic, radial-velocity data and stellar evolution models. The colors are a function of the distance to the effective temperature-stellar density constraint ellipse in standard error units: within 1σ (red), 2σ (yellow) and 3σ (blue). The star’s activity implies an age smaller than ~0.5 Ga, which indicated by solutions in shades of grey. The main constraint is obtained for a lightcurve analysis that includes the presence of spots. An analysis that does not account for spots yields a ~3% smaller radius, indicated by a dotted area (see text). The plain curves are obtained from standard evolution models using atmospheric boundary conditions that are parameterized by mean infrared κth and visible κv opacity coefficients, as in Fig. 11. The dashed and dotted curves are models from Leconte et al. (2009) and Gillon et al. (2010), respectively.
Current usage metrics show cumulative count of Article Views (full-text article views including HTML views, PDF and ePub downloads, according to the available data) and Abstracts Views on Vision4Press platform.
Data correspond to usage on the plateform after 2015. The current usage metrics is available 48-96 hours after online publication and is updated daily on week days.
Initial download of the metrics may take a while.