Fig. 11
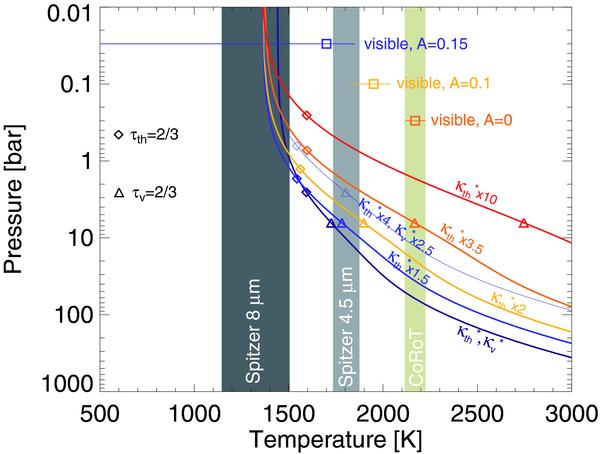
Possible atmospheric pressure-temperature profiles for CoRoT-2b compared to
observational constraints. The brightness temperatures obtained by Spitzer IRAC at
4.5 and 8 μm (Gillon et al.
2010) and by CoRoT in the optical (Alonso
et al. 2010b; Snellen et al. 2010)
are indicated by vertical grey bands. In the case of the optical brightness, the
corresponding physical atmospheric temperatures depend on the atmospheric geometric
albedo (A = 0 to 0.15), and are indicated by squares and with error
bars. Temperature profiles are calculated on the basis of a semi-grey analytical
model (Guillot 2010), with fiducial values of
the thermal and visible opacities  ,
,
 cm2 g-1,
and Tint = 1000 K. The different lines correspond to
different values of these coefficients (as labeled). The values of the assumed Bond
albedo are A = 0 (purple, orange, red curves),
A = 0.1 (yellow curve) and A = 0.15 (blue curves).
The levels for which thermal and visible optical depths equal 2/3 are indicated by
diamonds and triangles, respectively.
cm2 g-1,
and Tint = 1000 K. The different lines correspond to
different values of these coefficients (as labeled). The values of the assumed Bond
albedo are A = 0 (purple, orange, red curves),
A = 0.1 (yellow curve) and A = 0.15 (blue curves).
The levels for which thermal and visible optical depths equal 2/3 are indicated by
diamonds and triangles, respectively.
Current usage metrics show cumulative count of Article Views (full-text article views including HTML views, PDF and ePub downloads, according to the available data) and Abstracts Views on Vision4Press platform.
Data correspond to usage on the plateform after 2015. The current usage metrics is available 48-96 hours after online publication and is updated daily on week days.
Initial download of the metrics may take a while.