Free Access
Fig. 1
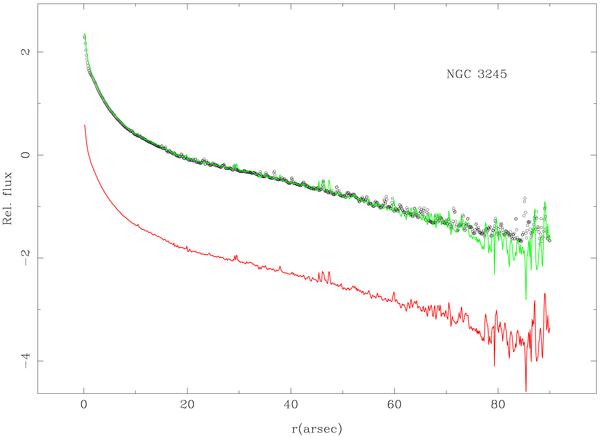
Surface brightness profiles for NGC 3245. The broad-band profile, I(Fwide), is plotted in black (circles points). The narrow-band profile, I(Fnarrow), is plotted in red. The green line is the narrow-band profile scaled to that of the broad-band.
Current usage metrics show cumulative count of Article Views (full-text article views including HTML views, PDF and ePub downloads, according to the available data) and Abstracts Views on Vision4Press platform.
Data correspond to usage on the plateform after 2015. The current usage metrics is available 48-96 hours after online publication and is updated daily on week days.
Initial download of the metrics may take a while.