Free Access
Fig. 2
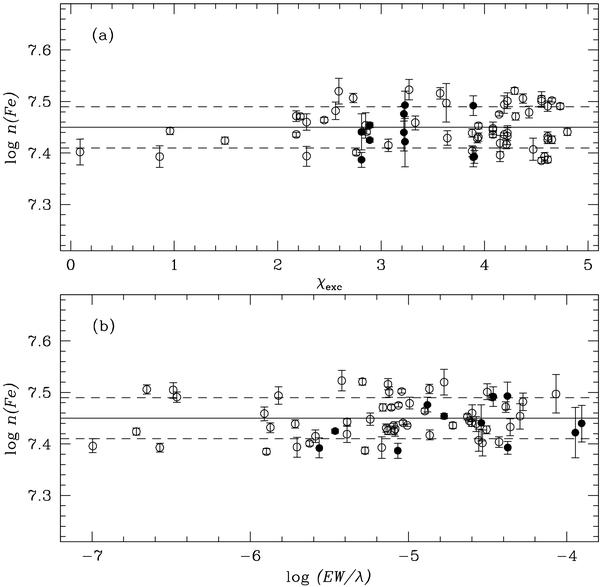
Analysis of the turn-off star S1275: a) Fe lines excitation equilibrium; b) relations between Fe abundances and equivalent widths. Open and filled circles represent the Fe I and Fe II lines, respectively. The solid line represents the mean iron abundance and the dashed lines represent the 1σ of the distribution.
Current usage metrics show cumulative count of Article Views (full-text article views including HTML views, PDF and ePub downloads, according to the available data) and Abstracts Views on Vision4Press platform.
Data correspond to usage on the plateform after 2015. The current usage metrics is available 48-96 hours after online publication and is updated daily on week days.
Initial download of the metrics may take a while.