Fig. 1
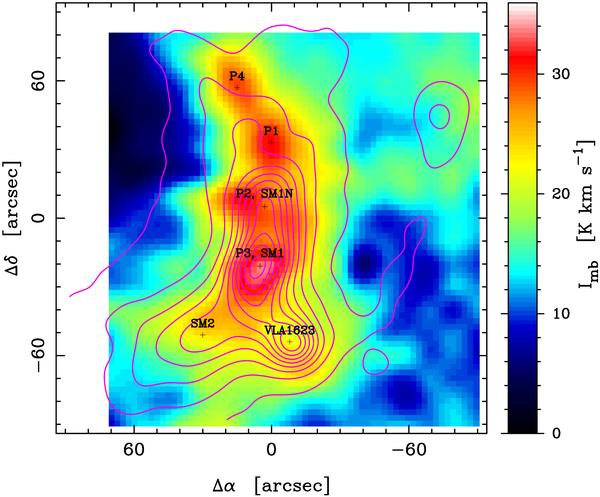
Colour image: the C18O(3−2) integrated intensity map of ρ Oph A cloud core from Liseau et al. (2010). The intensity scale is shown to the right. Contours: the 1.3 mm continuum data by Motte et al. (1998). The contours start at 0.15 Jy with subsequent contours at every increment of 0.15 Jy. The flux densities are given in a 15″ beam. We show the positions of the mm peaks from Motte et al. (1998) and the C18O peaks of Liseau et al. (2010). The map offsets are given relative the position α(J2000) = 16h26m27.2s and δ(J2000) = -24°23′34″.
Current usage metrics show cumulative count of Article Views (full-text article views including HTML views, PDF and ePub downloads, according to the available data) and Abstracts Views on Vision4Press platform.
Data correspond to usage on the plateform after 2015. The current usage metrics is available 48-96 hours after online publication and is updated daily on week days.
Initial download of the metrics may take a while.