Free Access
Fig. 3
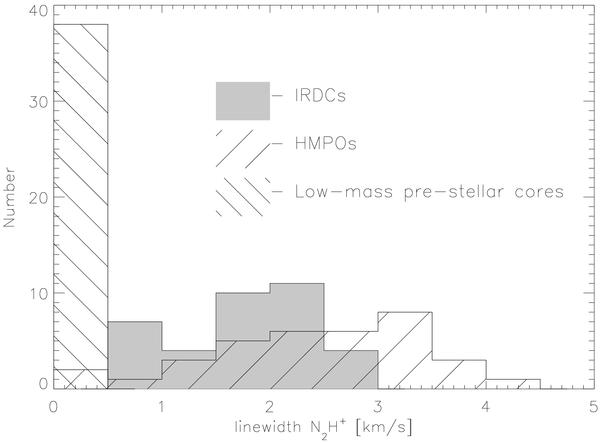
Distribution of N2H+ line width for our IRDCs sample, more evolved regions from Pirogov et al. (2003) and low-mass pre-stellar cores from Lee et al. (2001).
Current usage metrics show cumulative count of Article Views (full-text article views including HTML views, PDF and ePub downloads, according to the available data) and Abstracts Views on Vision4Press platform.
Data correspond to usage on the plateform after 2015. The current usage metrics is available 48-96 hours after online publication and is updated daily on week days.
Initial download of the metrics may take a while.