Free Access
Fig. 1
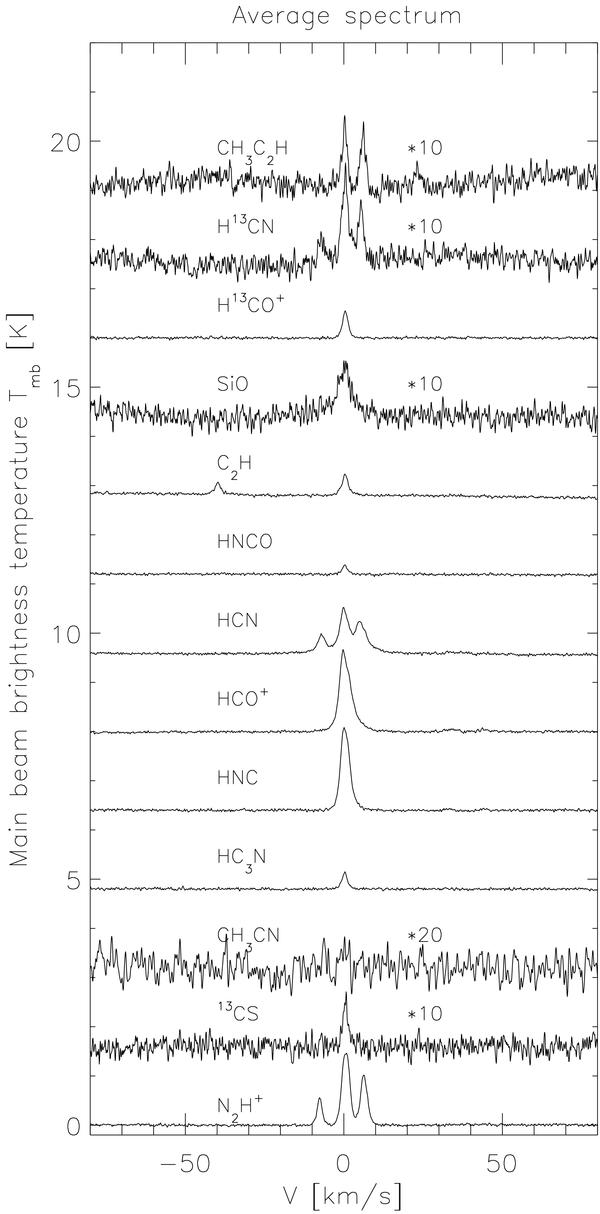
Average spectrum. Obtained by averaging all spectra for every species with equal weight after shifting all of them to the same reference velocity. Several weak detections are amplified by a factor of 10, and CH3CN is amplified by a factor of 20 for plotting.
Current usage metrics show cumulative count of Article Views (full-text article views including HTML views, PDF and ePub downloads, according to the available data) and Abstracts Views on Vision4Press platform.
Data correspond to usage on the plateform after 2015. The current usage metrics is available 48-96 hours after online publication and is updated daily on week days.
Initial download of the metrics may take a while.