Fig. 7
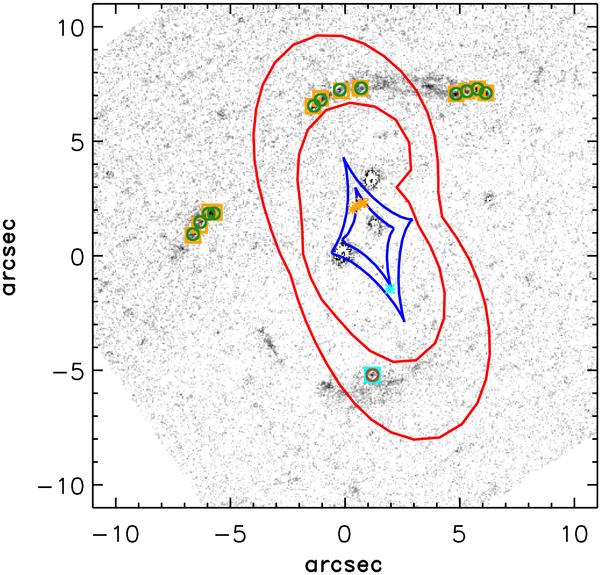
Tangential critical lines (red) and caustic lines (blue) for two different sources located at z = 1.0 and z = 1.7. As in Fig. 4, the circles show the measured positions of the images (input data for the model). The squares (orange and cyan) are the model-predicted image positions after optimization, and the asterisks (orange and cyan) the positions in the source plane. Although the cyan asterisk appears to over lay the caustic line, this is only an artifact, a product of the thick lines, and the size of the asterisks that we used to highlight the figure. The source is not over the caustic line.
Current usage metrics show cumulative count of Article Views (full-text article views including HTML views, PDF and ePub downloads, according to the available data) and Abstracts Views on Vision4Press platform.
Data correspond to usage on the plateform after 2015. The current usage metrics is available 48-96 hours after online publication and is updated daily on week days.
Initial download of the metrics may take a while.