Free Access
Fig. 9
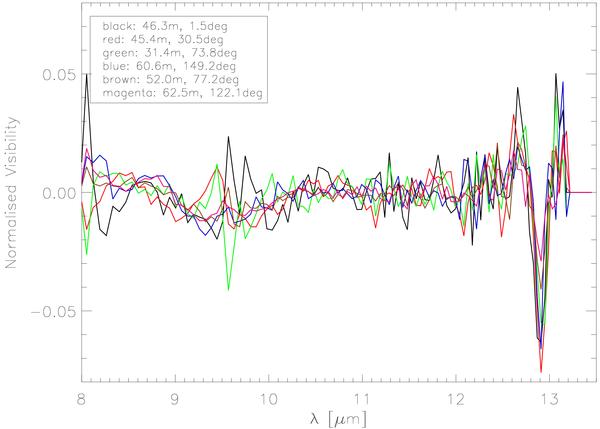
Normalised visibilities vs. wavelength for Mz3 (Chesneau et al. 2007). The prominent feature belongs to the bright 12.8 μm [NeII] nebular emission line. The noise increase at 9.7 μm corresponds to the narrow ozone feature. Observed baselines are indicated within the legend.
Current usage metrics show cumulative count of Article Views (full-text article views including HTML views, PDF and ePub downloads, according to the available data) and Abstracts Views on Vision4Press platform.
Data correspond to usage on the plateform after 2015. The current usage metrics is available 48-96 hours after online publication and is updated daily on week days.
Initial download of the metrics may take a while.