Free Access
Fig. 3
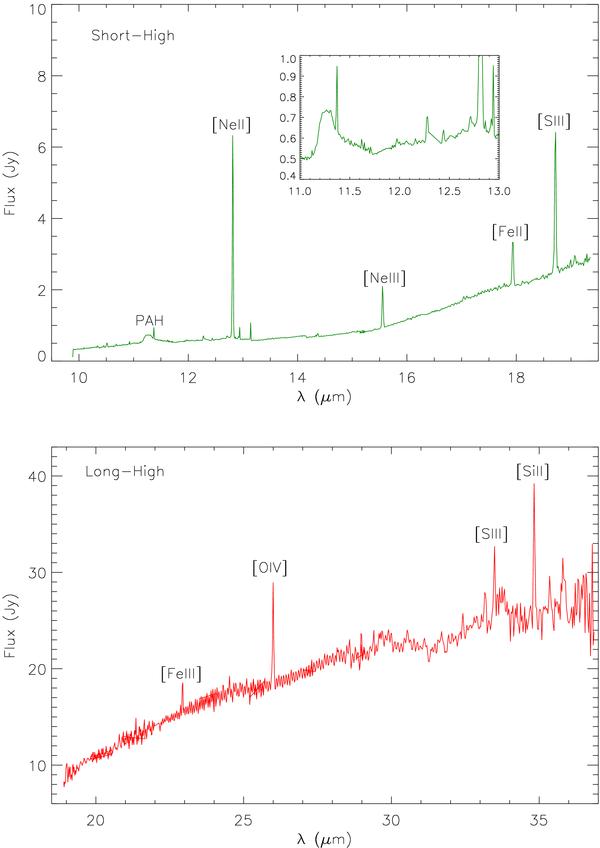
High-resolution spectra of the northern lobe of M2-9 by IRS/SPITZER. Upper curve corresponds to the Short-High slit and lower curve to the Long-High (for slit orientation, see Fig. 2). The inset in the upper plot is a close-up of the PAH emission features.
Current usage metrics show cumulative count of Article Views (full-text article views including HTML views, PDF and ePub downloads, according to the available data) and Abstracts Views on Vision4Press platform.
Data correspond to usage on the plateform after 2015. The current usage metrics is available 48-96 hours after online publication and is updated daily on week days.
Initial download of the metrics may take a while.