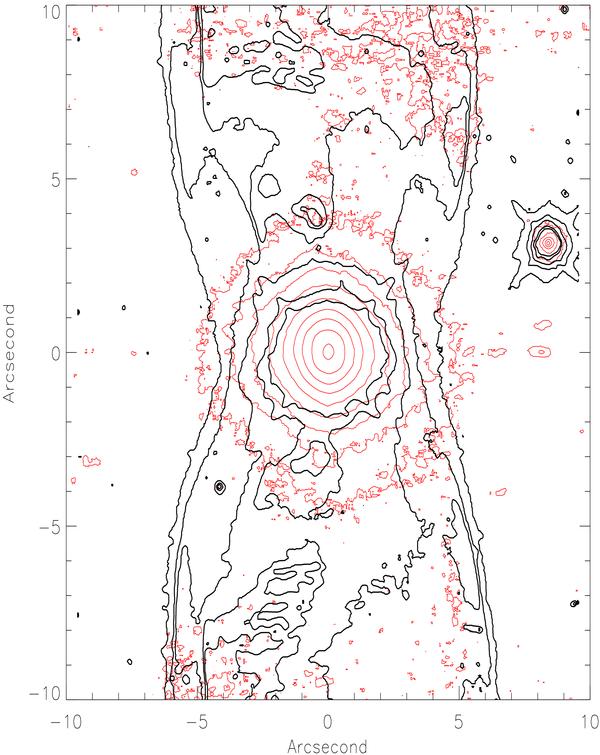
Fig. 1

Composition of HST/STIS (black) and NACO/Ks (red) images. North is up and east is on the left. The infrared emission contours follow the lines of the HST scattering in the visible, not only in the core but in a north-west region as well. The unresolved core is less than 0.1″ in Ks. Contours from the centre to low levels are 95, 10, 2, 0.8, 0.4, 0.2, 0.1, 0.05, 0.025 and 0.015% of the maximum, respectively. Noise appears in the last two lower levels and those reveal the extended nebula as it is evident on the northern and southern part of the image. The diffuse light is increasing smoothly from the 0.05 to the 10% level.
Current usage metrics show cumulative count of Article Views (full-text article views including HTML views, PDF and ePub downloads, according to the available data) and Abstracts Views on Vision4Press platform.
Data correspond to usage on the plateform after 2015. The current usage metrics is available 48-96 hours after online publication and is updated daily on week days.
Initial download of the metrics may take a while.


