Fig. 5
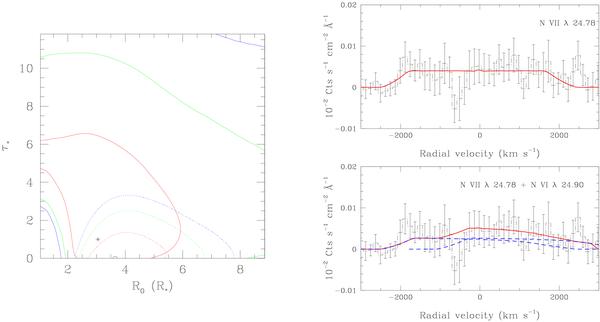
Left: shape of the 68.3%, 90% and 95.4% confidence contours in the (R0, τλ, ∗ ) parameter plane for the two fits to the nitrogen complex. The dotted contours correspond to the assumption that the line in the RGS spectrum is entirely due to N vii λ24.78, whilst the solid contours correspond to the assumption of an equal contribution from the N vi λ24.90 line. The open hexagon and the asterisk correspond to the formal best-fit models. Right: best-fit model (R0 = 3.65 R ∗ , τλ, ∗ = 0.0) assuming a pure N vii line (top) and a blend with N vi λ24.90 (R0 = 3.05 R ∗ , τλ, ∗ = 1.0, bottom panel). Error bars represent ± 1σ (one standard deviation). The feature at –500 km s-1 essentially corresponds to two bins and could be interpreted as the result of noise. Its existence thus needs confirmation.


Current usage metrics show cumulative count of Article Views (full-text article views including HTML views, PDF and ePub downloads, according to the available data) and Abstracts Views on Vision4Press platform.
Data correspond to usage on the plateform after 2015. The current usage metrics is available 48-96 hours after online publication and is updated daily on week days.
Initial download of the metrics may take a while.