Fig. 1
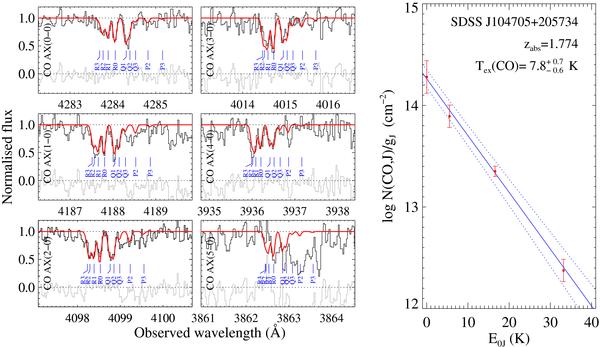
Left: A1Π(ν′) ← X1Σ + (ν = 0) electronic bands of CO detected at zabs = 1.774 towards the quasar SDSS J104705+205734. The modelled profile is over-plotted in red with the fitting residuals shown in grey. Short vertical lines indicate the branch (“R”, “P” or “Q”) and the rotational level of the transition (J = 0–3). Right: the corresponding excitation diagram of CO gives the column density of the rotational levels J weighted by their quantum degeneracy (gJ) versus the energy of these levels relative to the ground state. The excitation temperature is directly given by −1/(aln10) where a is the slope of the linear fit (solid blue line, with 1σ errors represented by the dotted curves).
Current usage metrics show cumulative count of Article Views (full-text article views including HTML views, PDF and ePub downloads, according to the available data) and Abstracts Views on Vision4Press platform.
Data correspond to usage on the plateform after 2015. The current usage metrics is available 48-96 hours after online publication and is updated daily on week days.
Initial download of the metrics may take a while.