Fig. 9
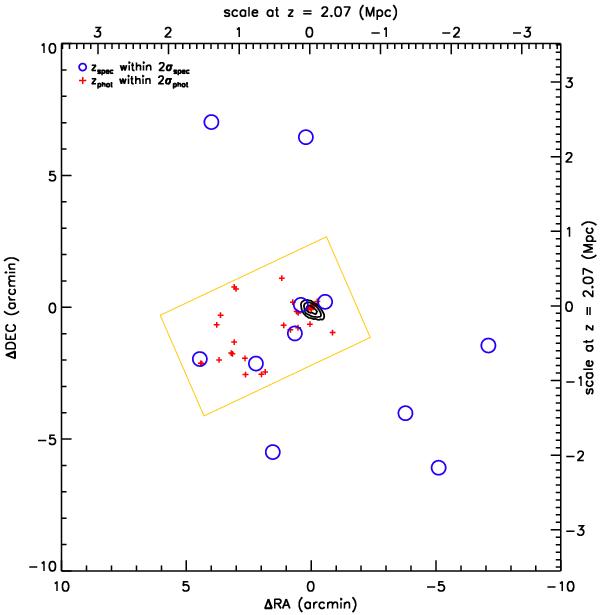
Spatial distribution of blue spectroscopic members, centred on the cluster. Galaxies with spectroscopic redshifts within 2σ of the z = 2.07 peak are shown by blue open circles. The positions of galaxies with zphot within 2σ of the z = 2.05 peak are shown by red crosses. The orange rectangle shows the field of MOIRCS and the 1, 2, and 3σ significance levels of the extended X-ray emission (as shown on Fig. 1 and discussed in Sect. 5) are drawn at the centre of the plot.
Current usage metrics show cumulative count of Article Views (full-text article views including HTML views, PDF and ePub downloads, according to the available data) and Abstracts Views on Vision4Press platform.
Data correspond to usage on the plateform after 2015. The current usage metrics is available 48-96 hours after online publication and is updated daily on week days.
Initial download of the metrics may take a while.