Fig. 7
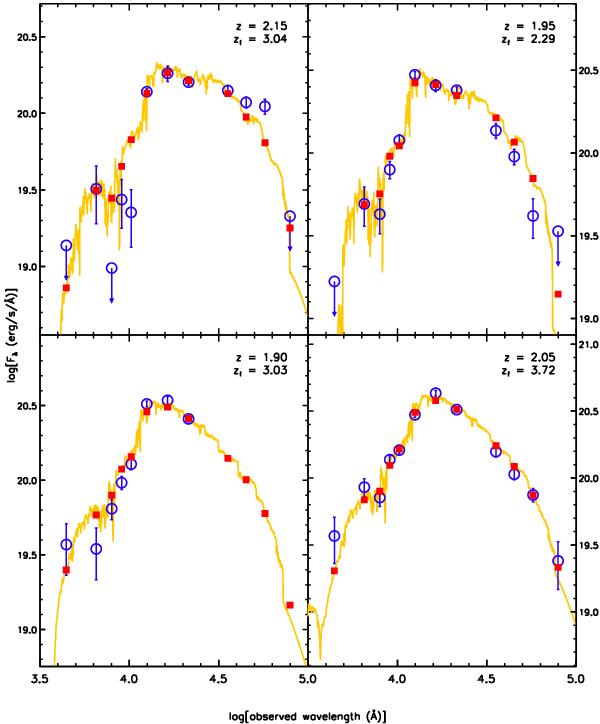
Spectral energy distributions of four representative red galaxies with photometric redshifts within 2σ of the peak of the distribution. The observed SEDs and errors are represented with blue open circles. Upper limits at 1σ are shown by arrows and the best fit template is shown in orange. The corresponding redshift and formation redshift, at which half of the stellar mass was in place, are given in the upper right corner of each sub-plot. The integrated template fluxes in the Suprime-Cam, MOIRCS and IRAC bands are shown by red squares.
Current usage metrics show cumulative count of Article Views (full-text article views including HTML views, PDF and ePub downloads, according to the available data) and Abstracts Views on Vision4Press platform.
Data correspond to usage on the plateform after 2015. The current usage metrics is available 48-96 hours after online publication and is updated daily on week days.
Initial download of the metrics may take a while.