Fig. 11
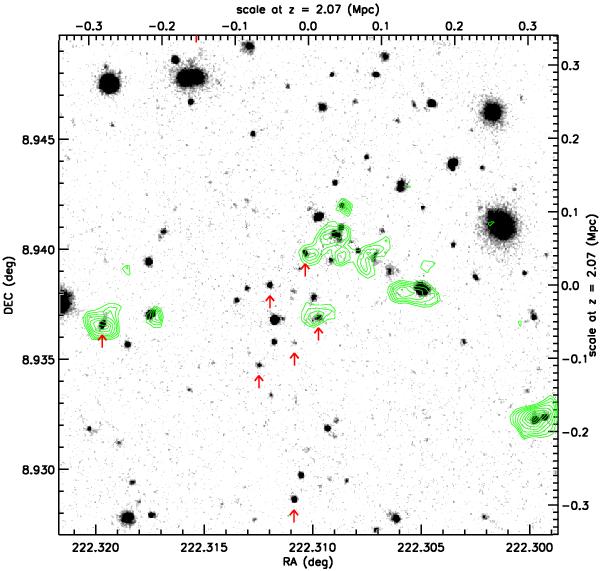
Ks-band image of the 1.4′ × 1.4′ field centred on the galaxy cluster, as in Figs. 1 and 8, the green contours showing the fluxes of the sources detected at 5σ or more in the MIPS 24 μm image. The red arrows show the positions of red (Y − Ks > 2) galaxies with rising IRAC fluxes ([5.8] − [8.0] > 0), suggesting the possible presence of obscured AGN activity.
Current usage metrics show cumulative count of Article Views (full-text article views including HTML views, PDF and ePub downloads, according to the available data) and Abstracts Views on Vision4Press platform.
Data correspond to usage on the plateform after 2015. The current usage metrics is available 48-96 hours after online publication and is updated daily on week days.
Initial download of the metrics may take a while.