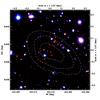
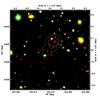
Fig. 1
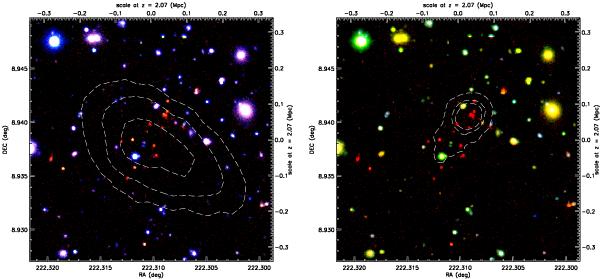
RGB composite colour images of the 1.4′ × 1.4′ field centred on the galaxy overdensity. The R channel of both images corresponds to the Ks band; the G and B channels corresponds to the J and z bands in the left image and to the B and z bands in the right one. The B and z images were taken using the Suprime-Cam instrument on the Subaru telescope while the J and Ks images are a composite of MOIRCS and ISAAC data, on the Subaru and VLT observatories. The BzKs image shows how the red galaxies are basically unseen at optical wavelengths. On the left, the white overlapping contours show the 1, 2, and 3σ significance levels of the diffuse X-ray emission in the XMM-Newton image, after subtraction of a point source seen in the Chandra image and smoothing with a 8′′ radius PSF (as described in Sect. 5). On the right, they show the 10, 20, and 30σ levels above the background galaxy number density, computed using the Σ5 estimator.
Current usage metrics show cumulative count of Article Views (full-text article views including HTML views, PDF and ePub downloads, according to the available data) and Abstracts Views on Vision4Press platform.
Data correspond to usage on the plateform after 2015. The current usage metrics is available 48-96 hours after online publication and is updated daily on week days.
Initial download of the metrics may take a while.