Free Access
Fig. 3
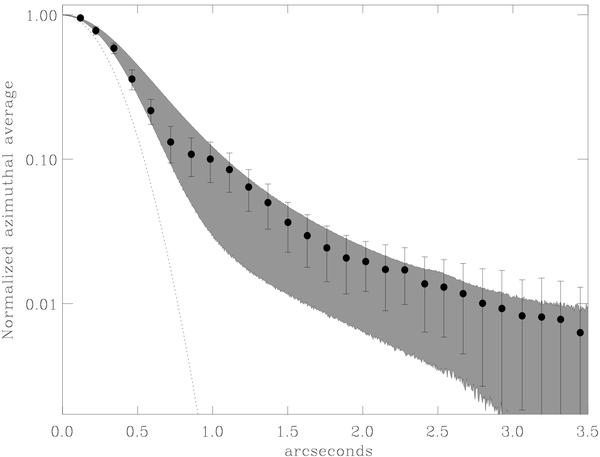
The normalized, azimuthally averaged, intensity profile at 24.5 μm of CRL 2136 (dots represent mean values and error bars are the standard deviations per distance bin). The shaded region indicates the predictions of the envelope model of Sect. 3.2. The dotted line represents the PSF with which the model was convolved.
Current usage metrics show cumulative count of Article Views (full-text article views including HTML views, PDF and ePub downloads, according to the available data) and Abstracts Views on Vision4Press platform.
Data correspond to usage on the plateform after 2015. The current usage metrics is available 48-96 hours after online publication and is updated daily on week days.
Initial download of the metrics may take a while.