Fig. 1
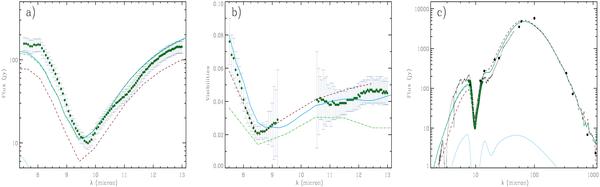
Observations (dots) and models (lines) presented in Sect.3.2. a) N-band flux spectra; b) Visibilities, observations affected by telluric absorption are omitted; c) SEDs, with observations taken from de Wit et al. (2009) compilation. Graph styles are the same for each panel: 1) green dash-dotted line – ZAMS star + envelope; 2) red dashed line – cool hypergiant + envelope; 3) blue full line – ZAMS star + envelope and a gaseous disk. Panel c) shows the spectrum of the accretion disk (blue dotted line) and the observed ISO-SWS spectrum (full black line). Models that fit the SED only (Sect. 3.1) are not shown here.
Current usage metrics show cumulative count of Article Views (full-text article views including HTML views, PDF and ePub downloads, according to the available data) and Abstracts Views on Vision4Press platform.
Data correspond to usage on the plateform after 2015. The current usage metrics is available 48-96 hours after online publication and is updated daily on week days.
Initial download of the metrics may take a while.