Fig. 2
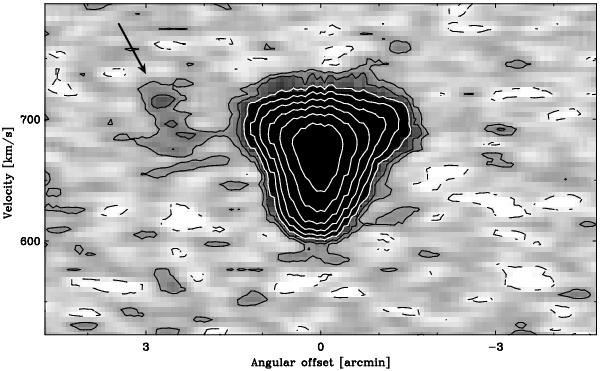
Position-velocity (PV) diagram for UGC 2082, plotted using the 30″-resolution cube. Contour levels begin at 300 μJy beam-1 (≈1.5σ; see Table 3) and increase by powers of two. The dashed contours are at −300 μJy beam-1. The line in Fig. 1 indicates the orientation of the PV slice shown here. The northeast end of the slice is to the left. At the distance listed in Table 1, 1′ corresponds to a linear scale of 3.11 kpc. The arrow indicates an extraplanar feature described in the text.
Current usage metrics show cumulative count of Article Views (full-text article views including HTML views, PDF and ePub downloads, according to the available data) and Abstracts Views on Vision4Press platform.
Data correspond to usage on the plateform after 2015. The current usage metrics is available 48-96 hours after online publication and is updated daily on week days.
Initial download of the metrics may take a while.