Fig. 2
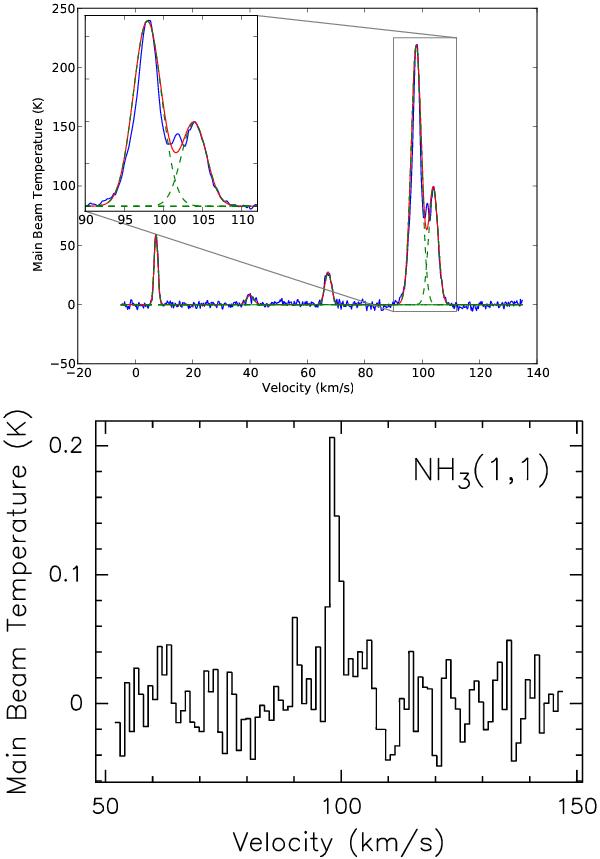
Example of 13CO spectrum (top, in blue) extracted from the GRS, along with the combined fit to all lines (red) for the Hi-GAL source detected at l = 29.9388°, b = 0.0167°. The green dashed lines indicate the individual Gaussian components that make up the overall spectrum. The 13CO spectrum exhibits several lines with very different velocities; thanks to the observed NH3 spectrum (bottom) the velocity of the source can be determined (98.41 km s-1).
Current usage metrics show cumulative count of Article Views (full-text article views including HTML views, PDF and ePub downloads, according to the available data) and Abstracts Views on Vision4Press platform.
Data correspond to usage on the plateform after 2015. The current usage metrics is available 48-96 hours after online publication and is updated daily on week days.
Initial download of the metrics may take a while.