Free Access
Fig. A.1
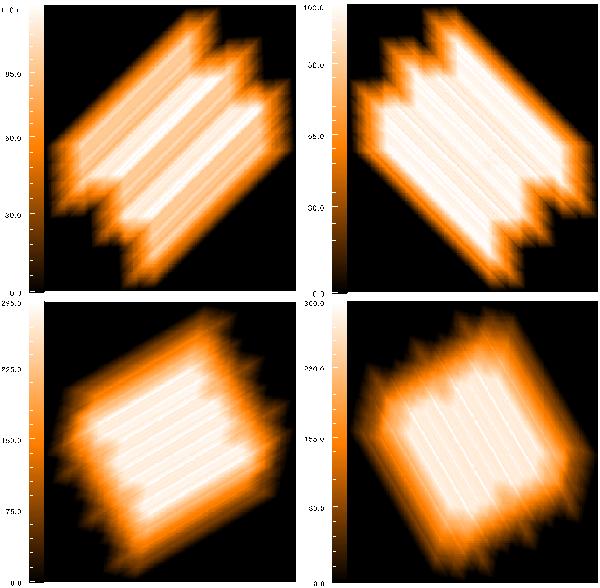
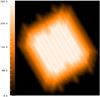
Top: coverage map of the scan and cross-scan (left and right) of TT Cyg obtained in SDP on OD 148. Bottom: coverage map of the scan and cross-scan of AQ And obtained in Routine Phase on OD 224. Until OD 221 the coverage of the scan map obtained at an angle of 45° was not uniform.
This figure is made of several images, please see below:
Current usage metrics show cumulative count of Article Views (full-text article views including HTML views, PDF and ePub downloads, according to the available data) and Abstracts Views on Vision4Press platform.
Data correspond to usage on the plateform after 2015. The current usage metrics is available 48-96 hours after online publication and is updated daily on week days.
Initial download of the metrics may take a while.