Free Access
Fig. 5
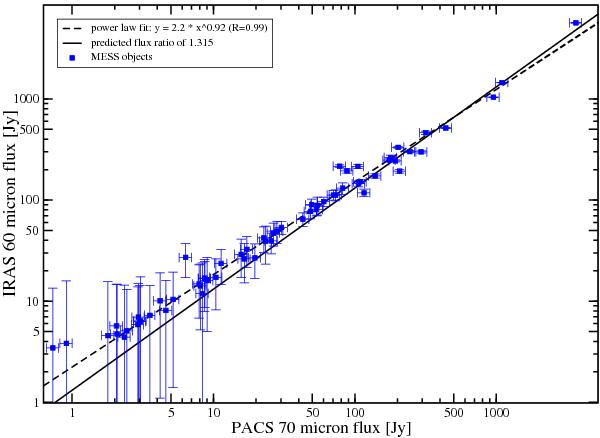
PACS 70 μm versus IRAS 60 μm flux densities for the 62 observed targets in Table 2 with counterparts in the IRAS point source catalog. The solid line shows the predicted flux ratio of 1.3 (see text) and the dashed line the powerlaw fit to all objects brighter than 10 Jy.
Current usage metrics show cumulative count of Article Views (full-text article views including HTML views, PDF and ePub downloads, according to the available data) and Abstracts Views on Vision4Press platform.
Data correspond to usage on the plateform after 2015. The current usage metrics is available 48-96 hours after online publication and is updated daily on week days.
Initial download of the metrics may take a while.